Figure 10.
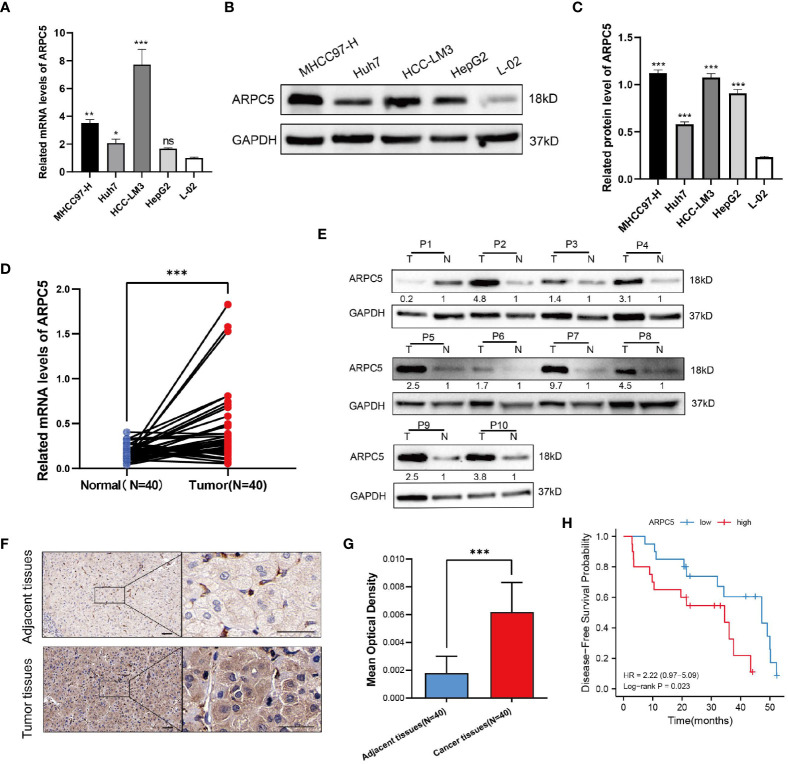
ARPC5 is upregulated in HCC cells and primary HCC tissues. (A) qPCR analysis of ARPC5 mRNA expression in four HCC cell lines (MHCC97-H, Huh7, HCC-LM3, and HepG2) and normal liver cell line (LO2). GAPDH was used as an internal control error bars represent M ± SEM (triplicate experiments). (B, C) The protein expression of ARPC5 was detected in four HCC cell lines and normal liver cell line with Western blot analysis. Error bars represent M ± SD of triplicate measurements. (D) The mRNA expression of ARPC5 in 40 pairs HCC tissues and adjacent para-carcinoma tissues was evaluated using qPCR. (E) Western blot analysis of ARPC5 protein expression in 10 paired HCC tissues and adjacent normal tissues. The number presented the relative protein expression levels of ARPC5. (F) Representative images of ARPC5 immunohistochemical staining analysis in the HCC tissue and adjacent normal liver tissue, original magnifications: ×40 and ×200. Scale bars, 50 μm. (G) Quantitative analysis of ARPC5 expression in HCC tissues based on mean optical density of immunohistochemical staining. Error bars represent the M ± SD of multiple tissues. (H) Kaplan–Meier curves showed that higher expression of ARPC5 was associated with poor DFS in HCC patients. *p < 0.05; **p < 0.01; ***p < 0.001. ns, no significance.

