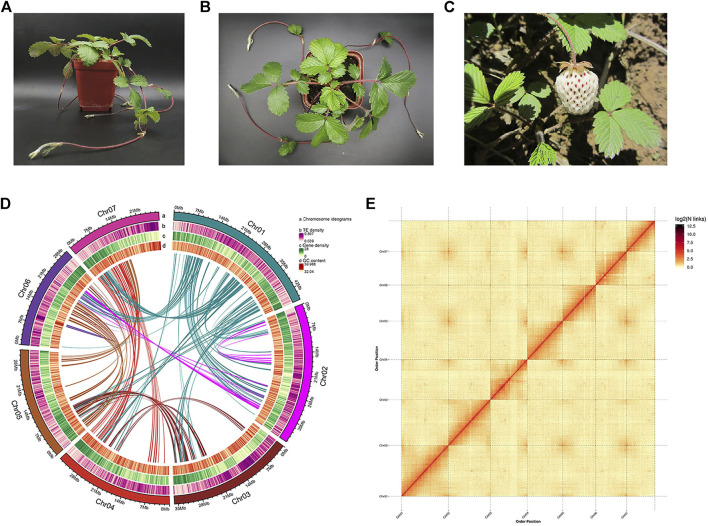
FIGURE 1.
Genome assembly of Fragaria pentaphylla-FP039. (A,B): Pictures of Fragaria pentaphylla-FP039 plant grown in the laboratory. (C) Pictures of Fragaria pentaphylla-FP039 plant grown in the wild where it was collected. (D) Circos plot of chromosome-level scaffolds showing the genomic features. Tracks from outside to the inner correspond to a, chromosome ideograms; b, TE (transposable elements) density; c, gene density; d, GC content. (E) Hi-C interaction heatmap showing interactions among seven chromosomes (the color bar on the right showing the interaction intensity).

