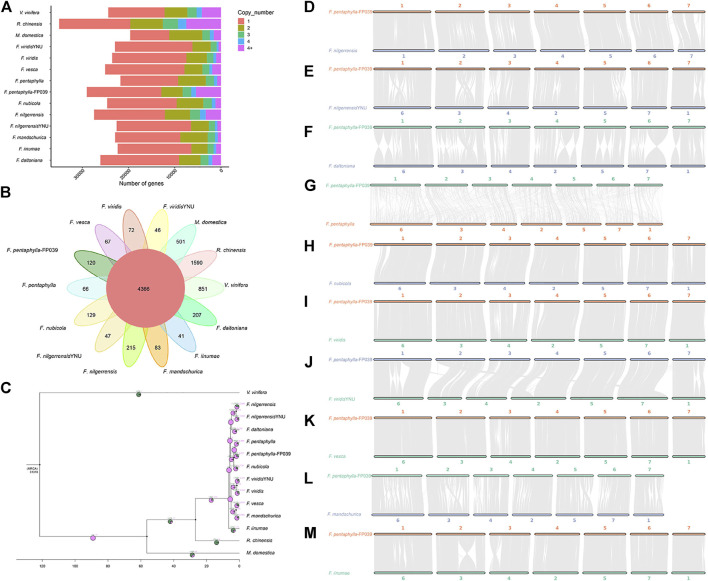
FIGURE 2.
Comparative genomics analysis of Fragaria pentaphylla-FP039 genome and other representative plant genomes. (A): Distribution of genes with different copy number in analyzed genomes. (B): Venn diagram of the shared and unique orthogroups calculated among the fourteen genomes. The number of shared orthogroups was showed in the center. And numbers of unique orthogroups of corresponding species were indicated outside. (C): Phylogenetic tree of 14 plant genomes with numbers of expanded (+)/contracted (−) orthogroups at each branch. The ratio of expansion and contraction orthogroups are indicated in the pie diagram with green and purple color, respectively. (D–M): Synteny analysis between F. pentaphylla-FP039 genome and the other ten genomes of diploid Fragaria species.

