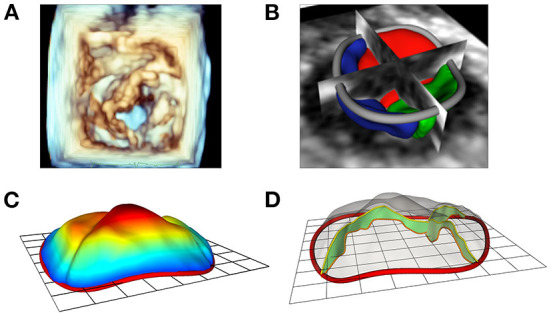
Figure 4.

Modeling of valve leaflets and quantification of annular and leaflet structure. (A) Volume rendering of a tricuspid valve using Phillips Qlab Software; (B) Visualization of a tricuspid valve (right atrial view) segmentation with slice intersections (blue = septal leaflet, red = anterior leaflet, green = posterior leaflet) in SlicerHeart; (C) Color intensity map depicting quantitative degree of billow in a tricuspid valve with 2D annular plane visible in SlicerHeart; (D) Visualization of leaflet coaptation regions with 2D annular plane visible in SlicerHeart.
