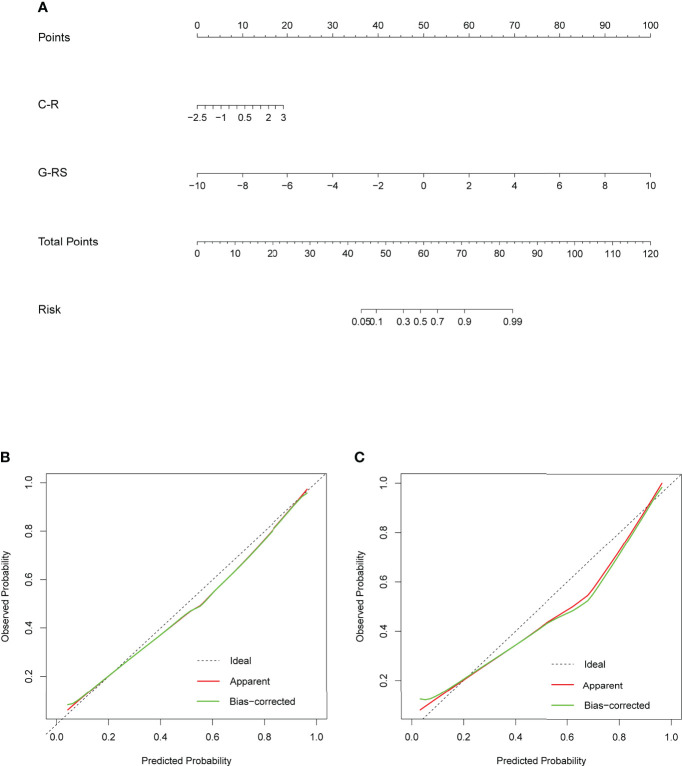
Figure 7.
(A) Nomogram based on clinical radiology and gross radiomics. Calibration curves of the nomogram in the training (B) and validation (C) sets; the x-axis indicates the predicted probability estimated by the nomogram, while the y-axis indicates the actual probability. Apparent probabilities and bias-corrected probabilities are indicated by red and green solid lines, respectively.

