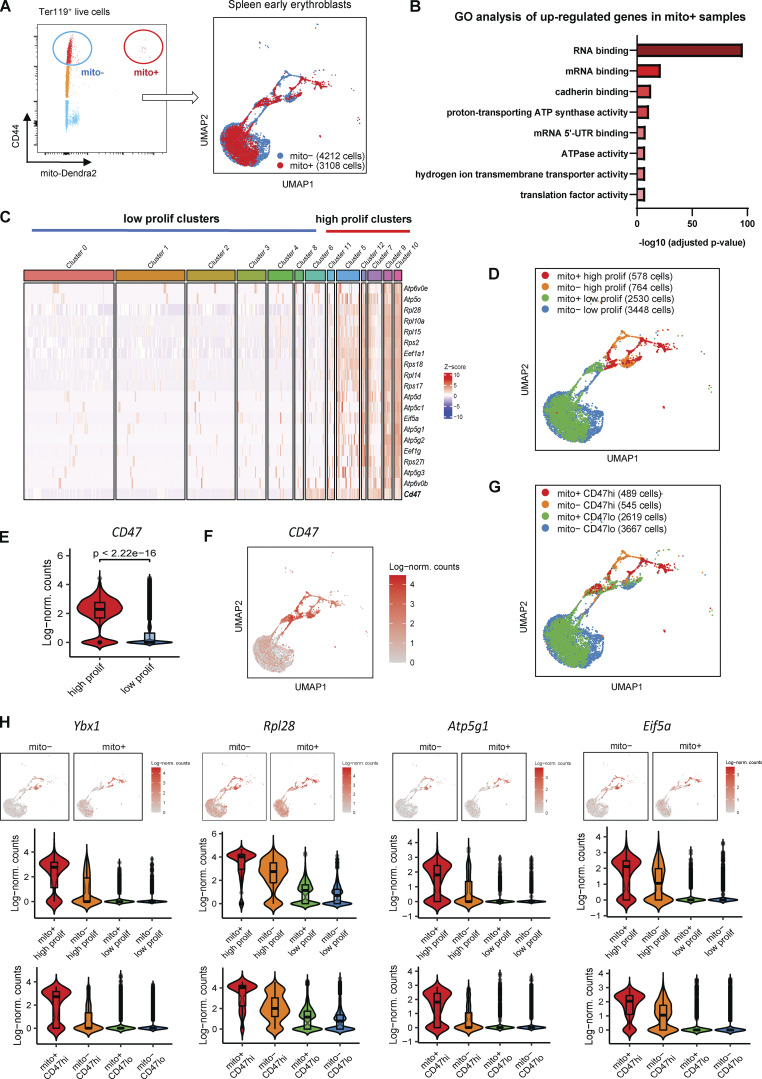
Figure 3.
Mitochondria transfer confers proliferation signatures to a subpopulation of early erythroblasts expressing CD47. (A) Gating strategy used to isolate mito-Dendra2− (mito−; without exogenous mitochondria transfer) and mito-Dendra2+ (mito+; with exogenous mitochondria transfer) early erythroblasts (left). UMAP visualization (right) of pooled scRNA-seq data is shown and includes 4,212 mito− cells and 3,108 mito+ splenic early erythroblasts. (B) Enrichment analysis (GO molecular function) of genes upregulated in mito+ early splenic early erythroblasts (vs. mito−) via EnrichR. (C) Gene expression profiling based on selected proliferation signatures among the 12 clusters identified from splenic pool of early erythroblasts, and their clustering into high and low proliferating clusters respectively. (D) UMAP visualization based on high and low proliferating clusters in the pooled (mito+ and mito−) splenic early erythroblasts. (E and F) Violin plots showing the differences in CD47 gene expression between high and low proliferating clusters, and (F) UMAP visualization of CD47 expression in splenic early erythroblasts. (G) UMAP visualization based on CD47hi and CD47lo clusters in the pooled (mito+ and mito−) splenic early erythroblasts. (H) Violin plots comparing the differences in selected proliferation signature gene expressions of high and low proliferating clusters vs. CD47hi and CD47lo clusters, in mito+ and mito− splenic erythroblasts respectively.

