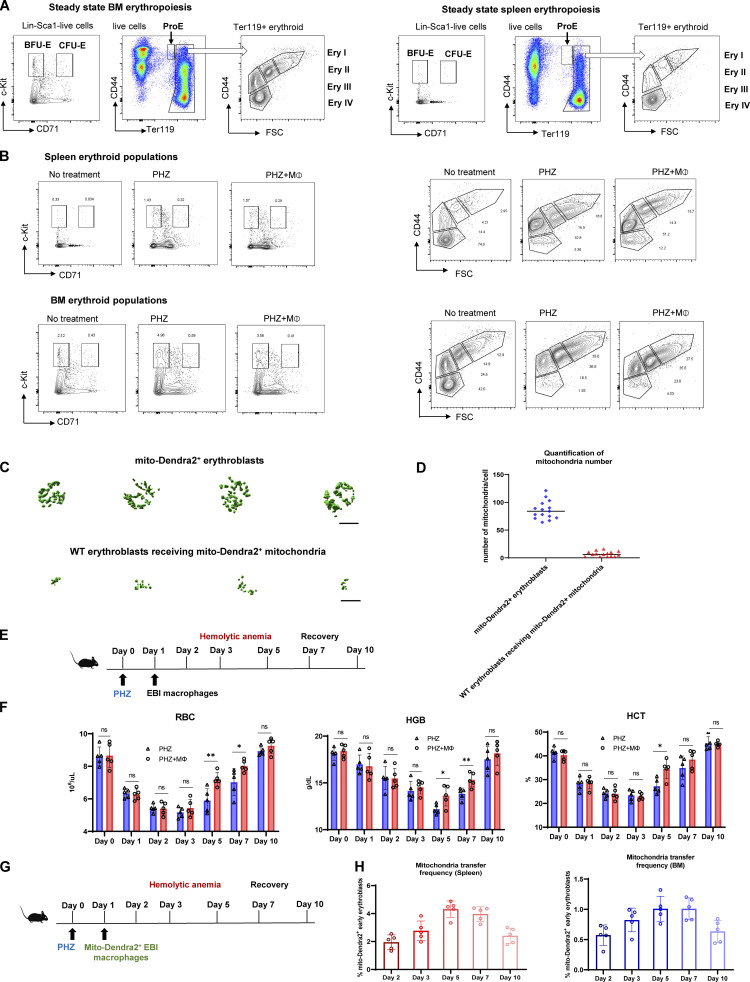
Figure S1.
Gating strategy and kinetics for erythroid regeneration and mitochondria transfer. (A) Representative flow cytometric plots showing the gating of BM/splenic erythroid populations based on c-Kit and CD71 expression (BFU-E and CFU-E) and Ter119 and CD44 expression (ProE, Ery I [basophilic], II [polychromatic], III [orthochromatic], IV [reticulocyte/RBC]) under steady state. (B) Representative flow cytometric plots showing the erythroid populations’ responses to PHZ stress, with or without EBI macrophage infusion in spleen and BM. (C and D) Representative isosurface rendering of super-resolution images of Ter119+CD44+ early stages of erythroblasts in native mito-Dendra2 donor mice (upper) and mito-Dendra2–labeled early erythroblasts in recipient wildtype mice (lower) and the numbers of mitochondria were quantified for both categories in D. (E) Schematic illustration of the experiment to analyze the kinetics of erythroid recovery at various time points after EBI macrophage infusion in PHZ stress model. (F) Peripheral blood analysis of the kinetic changes of RBC, HGB, and HCT levels in PHZ-treated mice in the presence and absence of EBI macrophage infusion during different time points of erythroid recovery phases. (G) Schematic illustration of the experiment to analyze the kinetic changes of mitochondria transfer at various time points after EBI macrophage infusion. (H) The kinetic changes of the frequency of mitochondria transfer, as indicated by the percentage of mito-Dendra2+ events, during different time point of erythroid recovery phases. Mean ± SEM; n = 5; *, P < 0.05; **, P < 0.01 by Student’s t test.

