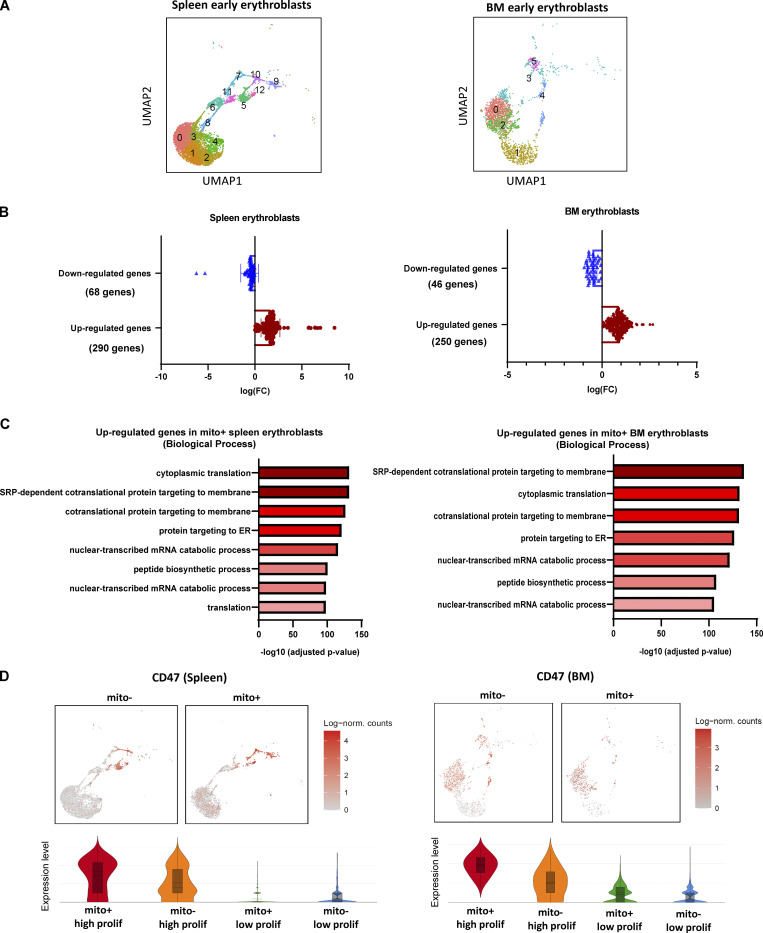
Figure S3.
Spleen and BM scRNA-seq analysis. (A) UMAP visualization of original clustering in the pooled (mito+ and mito−) early erythroblasts in spleen and BM. (B) Quantification of the number of up-regulated genes and down-regulated genes in spleen and BM erythroblast after mitochondria transfer. (C) Bar plots showing the enriched up-regulated GO biological processes from spleen (left) and BM (right) mito+ samples (vs. mito− samples) via EnrichR. (D) UMAP visualization and Violin plots comparing the differences in CD47 expressions of high and low proliferating clusters in mito+ and mito− spleen and BM erythroblasts respectively.

