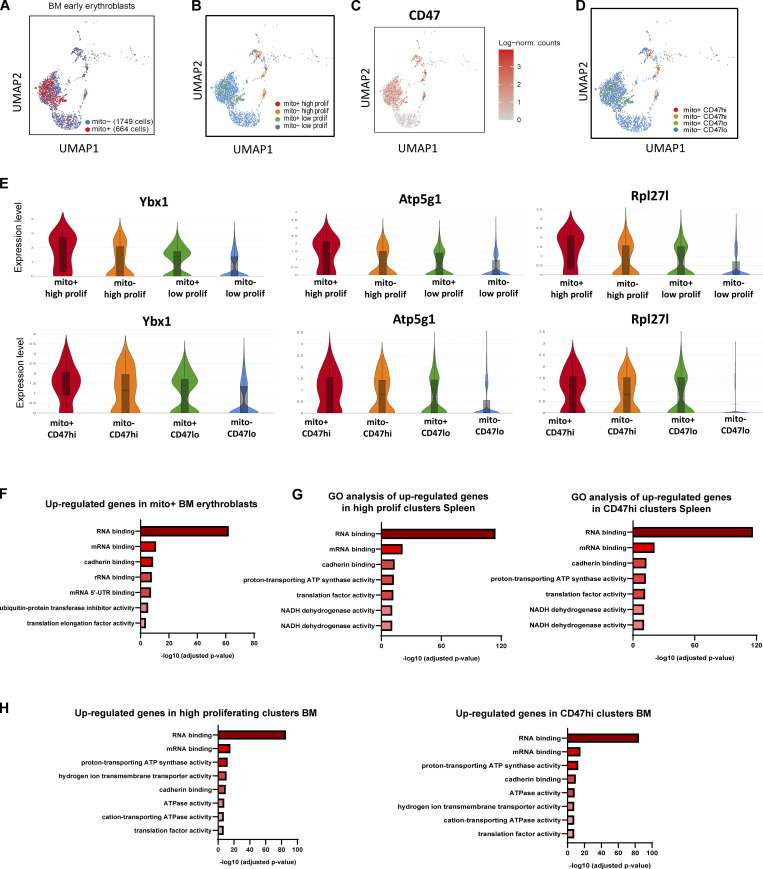
Figure S4.
BM and Spleen scRNA-seq and GO analysis. (A) UMAP visualization of pooled scRNA-seq data is shown including 1,749 mito− cells and 664 mito+ BM early erythroblasts. (B) UMAP visualization of re-clustering of high and low proliferating groups in the pooled (mito+ and mito−) BM early erythroblasts. (C) UMAP visualization of CD47 expression in BM samples. (D) UMAP visualization of re-clustering of CD47hi and CD47lo clusters in the pooled (mito+ and mito−) BM early erythroblasts. (E) Violin plots comparing the differences in selected proliferation signature gene expressions of high and low proliferating clusters vs. CD47hi and CD47lo clusters, in mito+ and mito− BM erythroblasts, respectively. (F) Bar plots showing the enriched up-regulated GO molecular functions from BM mito+ samples (vs. mito− samples). (G) Bar plots showing the enriched up-regulated GO molecular functions from splenic high proliferating clusters (vs. low proliferating clusters, left panel) and CD47hi clusters (vs. CD47lo, right panel) respectively. (H) Bar plots showing the enriched up-regulated GO molecular functions from BM high proliferating clusters (vs. low proliferating clusters, left panel) and CD47hi clusters (vs. CD47lo, right panel) respectively.

