
FIGURE 5.
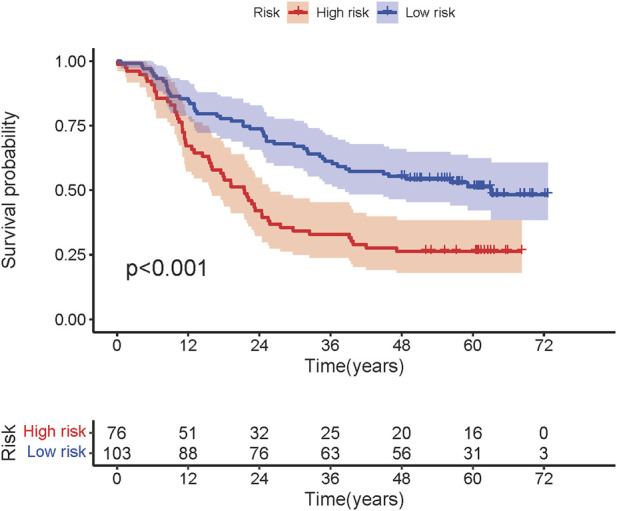
Kaplan-Meier curves for the overall survival of patients in the high- and low-risk group.
Official websites use .gov
A
.gov website belongs to an official
government organization in the United States.
Secure .gov websites use HTTPS
A lock (
) or https:// means you've safely
connected to the .gov website. Share sensitive
information only on official, secure websites.
Kaplan-Meier curves for the overall survival of patients in the high- and low-risk group.