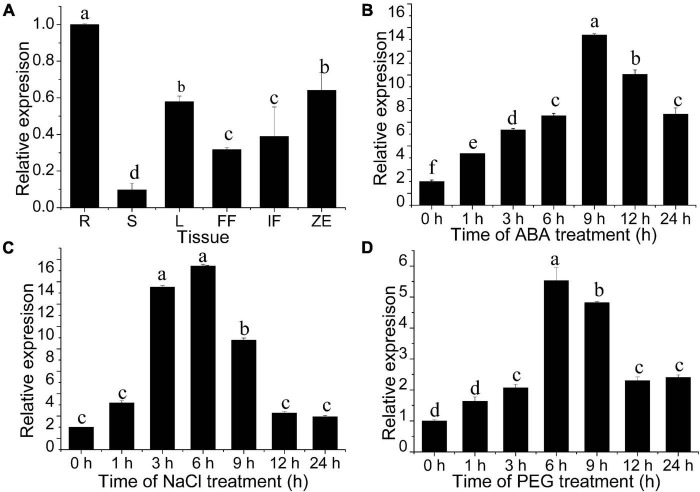
FIGURE 4.
Expression patterns of JrWOX11 as assessed by qRT-PCR. (A) Spatial and temporal expression of JrWOX11 in different tissues. (B–D) Relative expression of JrWOX11 under 100 μM ABA, salt (200 mM NaCl) and 10% (w/v) PEG 6000 solution. Error bars = SEM. Statistical differences were analyzed using Student’s t-test, n = 3. Different letters labeled indicate significant differences.

