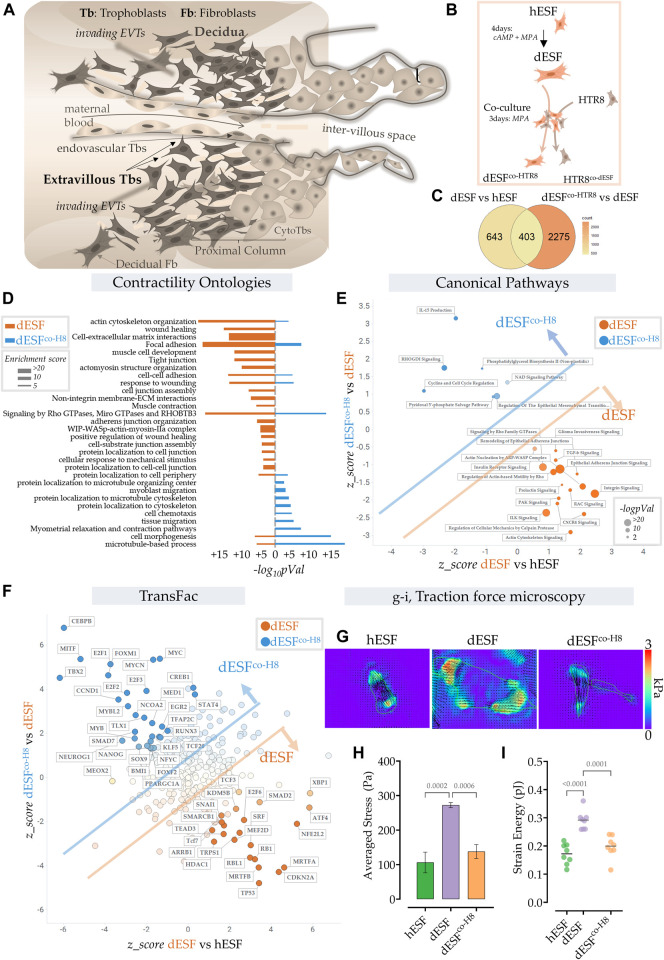
FIGURE 1.
Extravillous trophoblasts reduce contractile force generation by decidual endometrial fibroblasts. (A) Schematic showing the maternal fetal interface during placentation, wherein EVTs escape into the maternal stroma and deeply invade into the endometrium to eventually reach the spiral arteries. (B) Schematic showing the experimental plan for co-culture of dESFs with fluorescently labeled HTR8; cells were separated by fluorescent assisted cell sorting after 3 days of co-culture and sequenced. (C) Venn diagram showing gene counts differentially regulated between undifferentiated ESFs (hESFs), and decidualized ESFs (dESFs), and between dESFs co-cultured with HTR8 (dESFco-H8) and dESFs. (D) Activation of Contractility related ontologies in dESFs and dESFco−H8. Thickness of bar plot shows enrichment score of the relevant ontology. (E). Activation of canonical pathways in dESFs compared to hESFs or in dESFco-H8 vs. dESFs; Axes represent the activation or inhibition (z-score) of relevant ontologies; Ontologies that are upregulated in dESFs (compared to hESFs) but go down with co-culture (dESFco−H8) are labeled orange, and ontologies upregulated in dESFco−H8 are labeled blue. Size of the bubble reflect -log (p-Val) in that quadrant. Calculated using Ingenuity Pathway (IPA) analysis. (F). Transcriptional factors (TransFac) upregulated in dESFs and then downregulated after co-culture are labeled orange) or downregulated with decidualization (dESFs), and then upregulated with co-culture (dESFco−H8) are labeled blue. Calculated using Ingenuity Pathway (IPA) analysis. (H–I). Traction force microscopy: (H). Representative traction force vector maps and strain energy maps in hESF with decidualization (dESF) and after co-culture treatment (dESFco-H8). Anova with Tukey’s correction was used for quantification of average cellular stress (H), and strain energy (I); n > 10 cells per condition.

