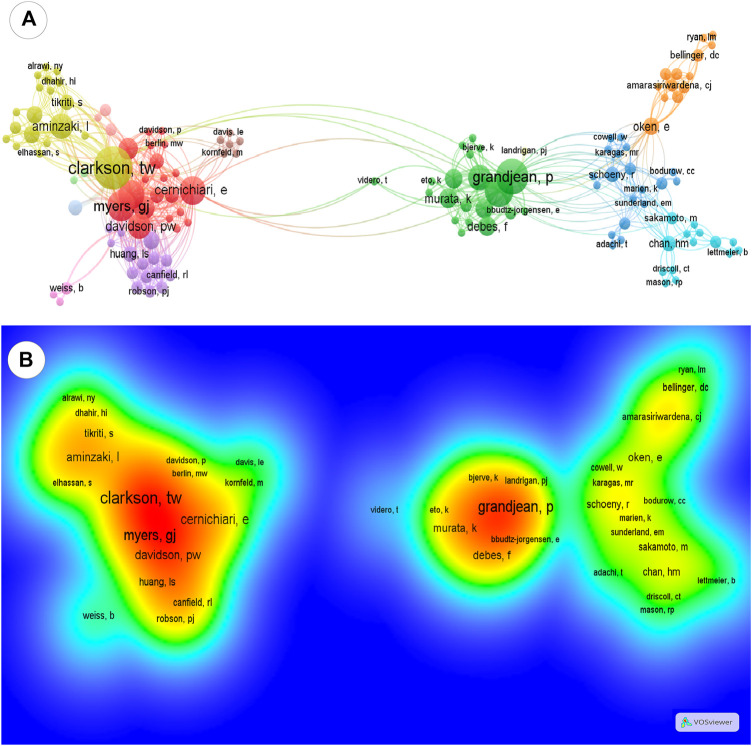
FIGURE 2.
Network of co-authorship and density citation view of authors. (A) Network visualization of the top 100 most-cited papers about maternal exposure to MeHg and offspring health outcomes: same colors represent the same cluster, and lines between clusters are co-citation links between the authors. The closer the authors are located to each other, the stronger their relatedness. (B) Density visualization: colors indicate the citation density of authors, ranging from blue (lowest density) to red (highest density).

