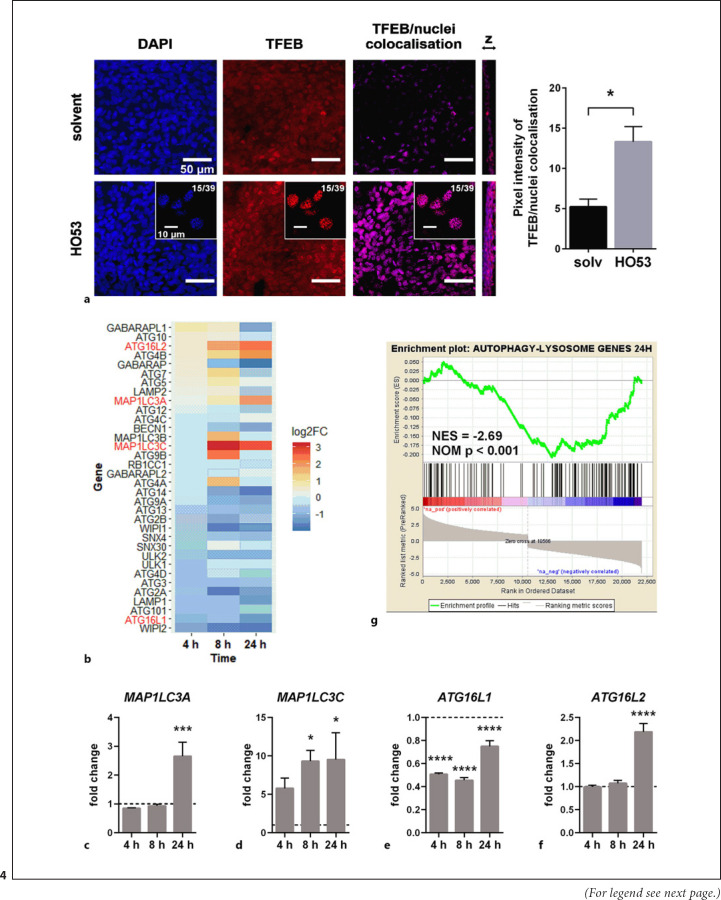
Fig. 4.
HO53 treatment leads to nuclear translocation of TFEB and augments expression of autophagy-related genes in differentiated BCi cells. aAnalysis of TFEB nuclear translocation upon treatment with 75 μM HO53 after 24 h by confocal imaging of nuclei (blue, DAPI), TFEB (red), and extracted signal from co-localized TFEB/nuclei (pink) from merged channels with scale bar 50 μm. Representative single slices from z-stacked images (15/39) were placed for each channel of HO53-treated samples with scale bar 10 μm. The representative images from at least 3 different areas of the ALI filter from n = 3 independent experiments with quantification of pixel intensity for a signal from co-localized TFEB/nuclei (pink) extracted from merged DAPI/TFEB images ± SEM. Statistical analysis was performed by using an unpaired t-test with Welch's correction, *p < 0.05. Changes in autophagy-related genes expression in differentiated BCi cells in ALI at 4 h, 8 h, and 24 h of treatment with HO53. bA heatmap showing the expression level represented as a log2FC of significantly differentially expressed genes in comparison to control cells collected at the same time points (p < 0.05). Genes selected for further analysis were marked in red. Nonsignificant differentially expressed genes have arbitrary value 0. Expression level of selected autophagy-related genes: MAP1LC3A (c), MAP1LC3C (d), ATG16L1 (e), and ATG16L2 (f) analyzed by qRT-PCR. Gene expression was represented as a fold change in comparison to control cells (value 1, dashed line) collected at the same time point as treated cells and normalized to the EEF2 reference gene. n = 3 trans-well inserts from 3 independent experiments ± SEM. *p < 0.05, ***p < 0.001, ****p < 0.0001 versus control cells analyzed by one-way ANOVA with the Dunnett post hoc test. gEnrichment plot for autophagy-lysosomal genes obtained from GSEA of the expression data from differentiated BCi cells in the ALI culture after 24 h of treatment with HO53. NES and NOM p are indicated on the plot. log2FC, log2 fold change; NES, normalized enrichment score; NOM p, nominal p value; SEM, standard error of mean.

