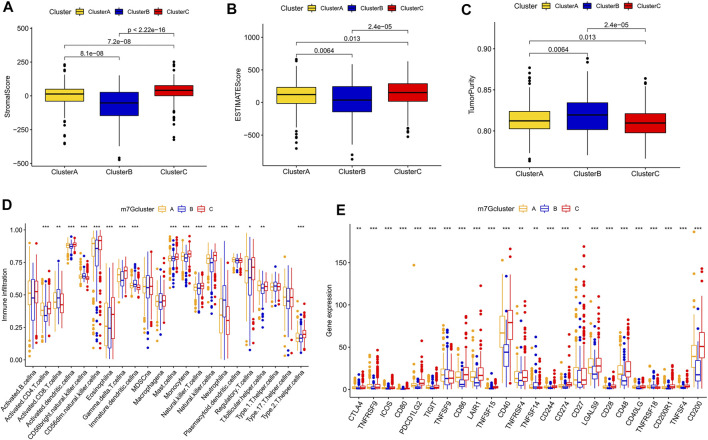
FIGURE 3.
Differences in the immune microenvironment among different subtypes. (A–C) Differences in stromal and ESTIMATE scores and tumor purity among different subtypes. (D) Differences in immune cell infiltration among different subtypes based on ssGSEA. (E) Differences in immune checkpoint expression among different subtypes.

