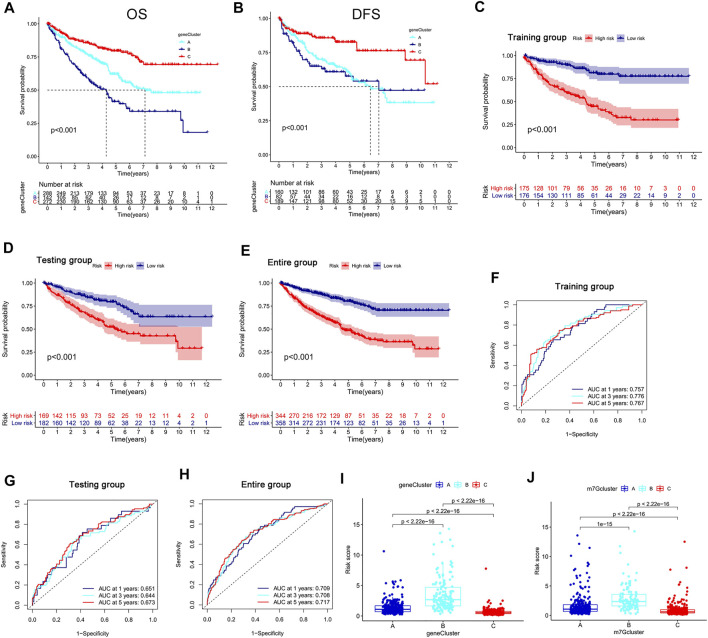
FIGURE 4.
Development and validation of the m7G score. (A,B) K–M analysis of OS and DFS among different gene subtypes. (C–E) K–M survival analysis between high- and low-risk groups in the training and testing groups and the entire group. (F–H) ROC curve evaluating the prediction accuracy of the m7G score in the training and testing groups and the entire group. (I,J) Risk scores of different genes and m7G clusters. K–M, Kaplan–Meier; OS, overall survival; DFS, disease-free survival; ROC, receiver operator curve.

