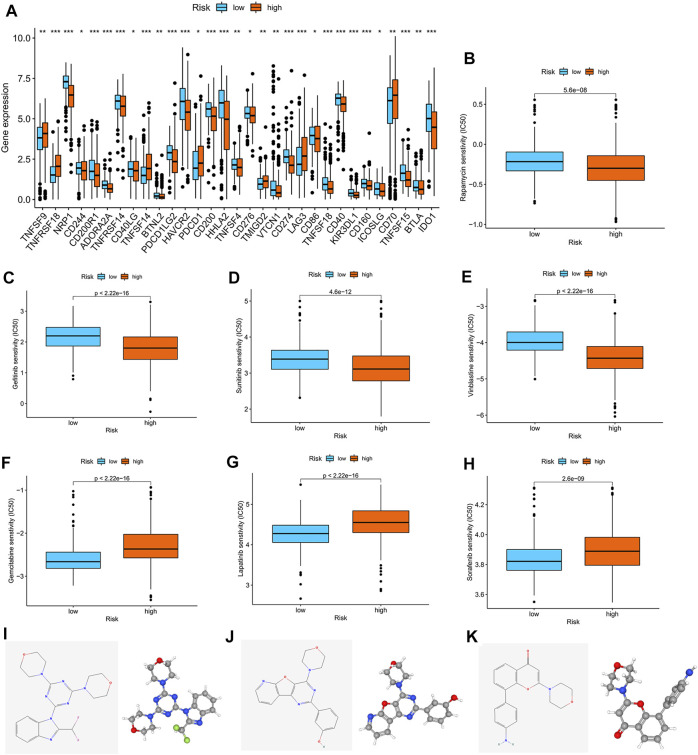
FIGURE 7.
Correlation analysis between the m7G score and therapeutic drugs. (A) Expression profiles of checkpoints in the high- and low-risk groups. (B–H) Correlation analysis between the m7G score and IC50 of rapamycin, gefitinib, sunitinib, vinblastine, gemcitabine, lapatinib, and sorafenib. The 2D and 3D structures of (I) ZSTK-474, (J) PI-103, and (K) PI-828.

