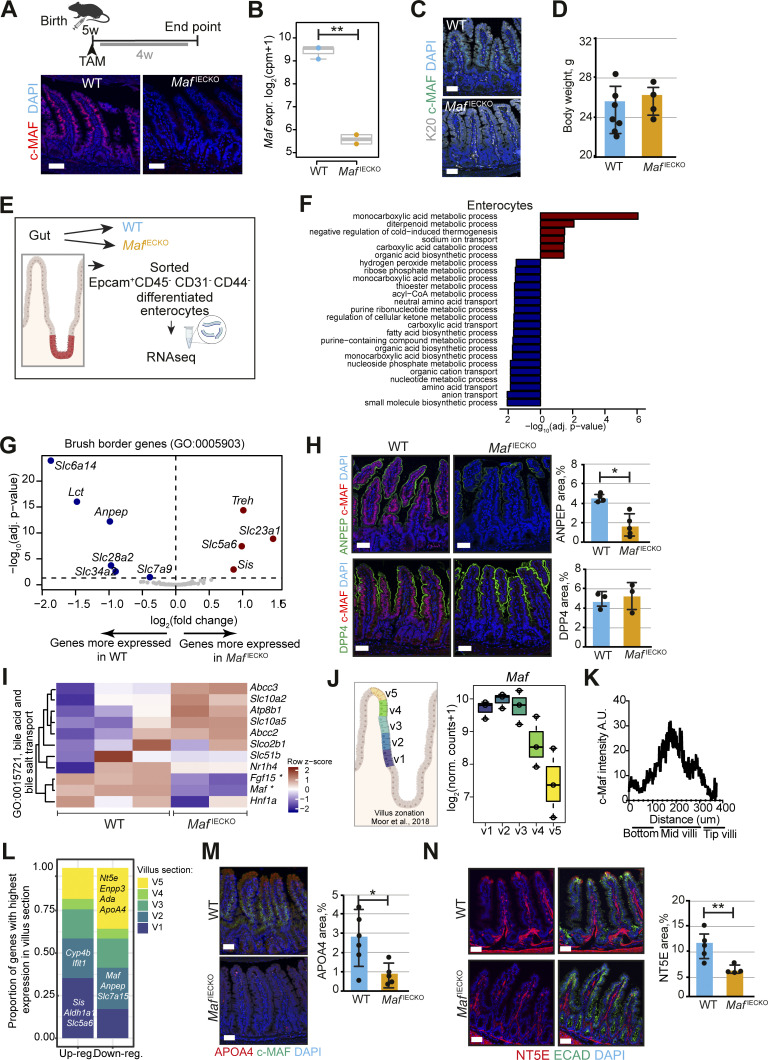
Figure 2.
Loss of Maf in adult enterocytes alters their transcriptional zonation program. (A) Maf depletion in MafIECKO mice. Staining for c-MAF (red), and DAPI (blue). WT and MafIECKO mice 1 mo after the initiation of depletion. n = 10 WT, n = 11 MafIECKO analyzed from three different cohorts. Scale bar, 50 μm. (B) Maf levels are significantly reduced in MafIECKO mice. n = 3 WT; n = 2 MafIECKO. Wald test in DESeq2; **, P < 0.01. (C) Maf depletion does not change overall enterocyte differentiation. Staining for Krt20 (K20, white), c-MAF (green) and DAPI (blue). Data analyzed from two different cohorts. Scale bar, 50 μm. (D) Maf depletion does not affect mouse weight. Two-tailed unpaired Student’s t test; n = 7 WT; n = 4 MafIECKO. n.s., not significant. Data analyzed from two different cohorts and shown as mean ± SD. (E) Sorting strategy for isolation of differentiated enterocytes from WT and MafIECKO mice for RNAseq, created with Biorender.com. (F) Signaling pathways enriched in MafIECKO vs. WT mouse enterocytes. Bar plots of GO gene sets significantly (adjusted P value <0.05) over-represented (red bars) or under-represented (blue bars) in MafIECKO vs. WT mice after 1 wk of Maf depletion. n = 3 WT, n = 2 MafIECKO. One-sided Fisher’s exact test followed by Benjamini–Hochberg P value adjustment. (G) Volcano plot of differentially expressed brush border genes (GO: 0005903) in MafIECKO mice (Wald test in DESeq2). (H) ANPEP but not DPP4 is reduced upon Maf depletion. Staining for ANPEP or DPP4 (green), c-MAF (red), and DAPI (blue). Scale bar, 50 μm. Percentage of area per tissue in WT and MafIECKO mice. Data shown as mean ± SD. Two-tailed unpaired Student’s t test; *, P < 0.05. ANPEP n = 4 WT; n = 5 MafIECKO; DPP4 n = 3 WT; n = 3 MafIECKO. (I) Heatmap of bile acid regulators, Maf and Fgf15 were significantly different in MafIECKO versus WT mice (Wald test in DESeq2). (J) Maf expression is zonated along small intestinal villus, as observed along villus zones described in Moor et al. (2018), created with Biorender.com. (K) c-MAF protein intensity along villi; n = 4 WT mice. (L) Proportion of genes differentially expressed upon Maf loss with highest expression in the five different villus zones described in Moor et al. (2018). Most genes induced in the absence of Maf have their highest expression level in proximal zone v1, while most decreased genes in the absence of Maf are highly expressed in villus tip zone v5. Examples of transcripts characteristic of each zone are indicated. (M) Marker of v4 and v5 zones APOA4 is reduced in MafIECKO mice. Staining for c-MAF (green), APOA4 (red), and DAPI (blue). Scale bar, 50 μm. Percentage of area in WT and MafIECKO mice. Two-tailed unpaired Student’s t test; *, P < 0.05. n = 6 WT; n = 5 MafIECKO. Data analyzed from two different cohorts and shown as mean ± SD. (N) NT5E is downregulated after Maf depletion. Staining for NT5E (red), E-cadherin (green), and DAPI (blue). The percentage of NT5E in the epithelial area is represented as mean ± SD. Two-tailed unpaired Student’s t test; **, P < 0.01. N = 5 WT, n = 4 MafIECKO. Scale bar, 50 µm. Data analyzed from two different cohorts and shown as mean ± SD.

