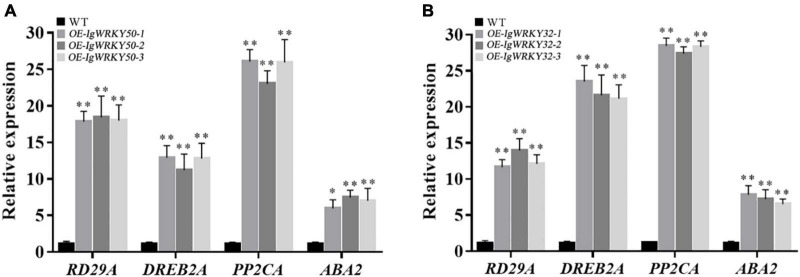
FIGURE 12.
Expression levels of stress-responsive genes under regulation of IgWRKY50 (A) and IgWRKY32 (B). The vertical ordinates are fold changes, and the horizontal coordinates are gene names. Data are means ± SD of three independent experiments, and asterisks (*or**) represent the significant differences at p < 0.05 or p < 0.01, respectively (Student’s t-test).

