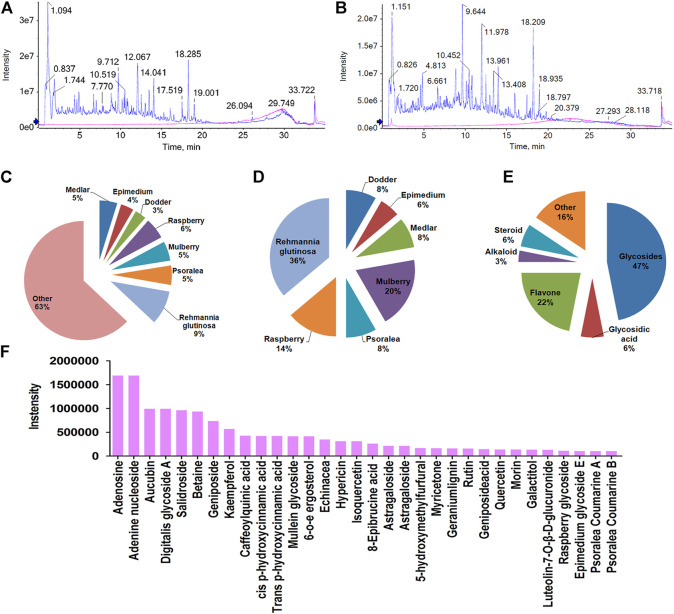
FIGURE 4.
Chemical composition of CHMACS. HPLC/MS spectra of CHMACS in the (A) positive and (B) negative ion modes. (C) Distribution of chemical components of CHMACS and (D) of those with intensity >100,000. These active components were mainly derived from R. glutinosa, mulberry, raspberry, Psoralea, and other CHMs. (E) Classification of the active components of CHMACS based on their chemical properties. (F) Chemical components of CHMACS according to their intensity.

