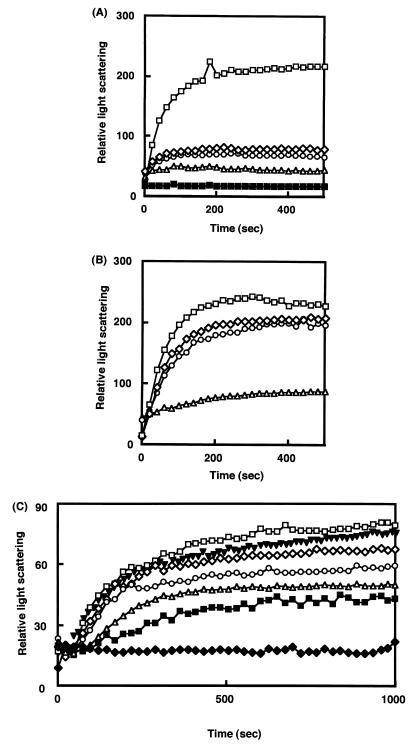
FIG. 4.
Light scattering patterns of B. thermoglucosidasius HrcA in the presence of DNA (A) and other proteins (B) and effect of temperature on light scattering patterns (C). Incubation was at 15°C throughout the experiments in panels A and B. (A) 25 μg of B. thermoglucosidasius HrcA (final concentration, 0.2 μM) in 0.1 ml of 20 mM Tris-HCl–5 mM EDTA–3 M urea (pH 7.5) was added to the solution (2.9 ml) as follows: no DNA (□), 50 μg of plasmid DNA pUC119 (◊), 100 μg of pUC119 (○), 20 μg of plasmid DNA pTY-1 containing the CIRCE element (▵), and 50 μg of pTY-1 (■). (B) The solution contained HrcA (final concentration, 0.2 μM) alone (◊) or with bovine serum albumin (0.2 μM; □); B. thermoglucosidasius DnaK (0.2 μM; ○) or B. thermoglucosidasius GroEL (0.2 μM; ▵). (C) The solution (3.0 ml) containing HrcA (25 μg) and plasmid DNA pTY-1 (20 μg) was preincubated with stirring at 15°C for 3 min; then the cuvette was transferred into the cell holder of a fluorescence spectrophotometer set at 15°C (⧫), 40°C (■), 50°C (▵), 60°C (○), 65°C (◊), or 70°C (□). In the experiment to investigate the effect of B. thermoglucosidasius GroEL (▾), the GroEL protein (final concentration, 0.2 μM) was added to the solution mixture in the cuvette, which was then transferred into the cell holder set at 70°C. Data collection always started when the cuvette was transferred into the cell holder.

