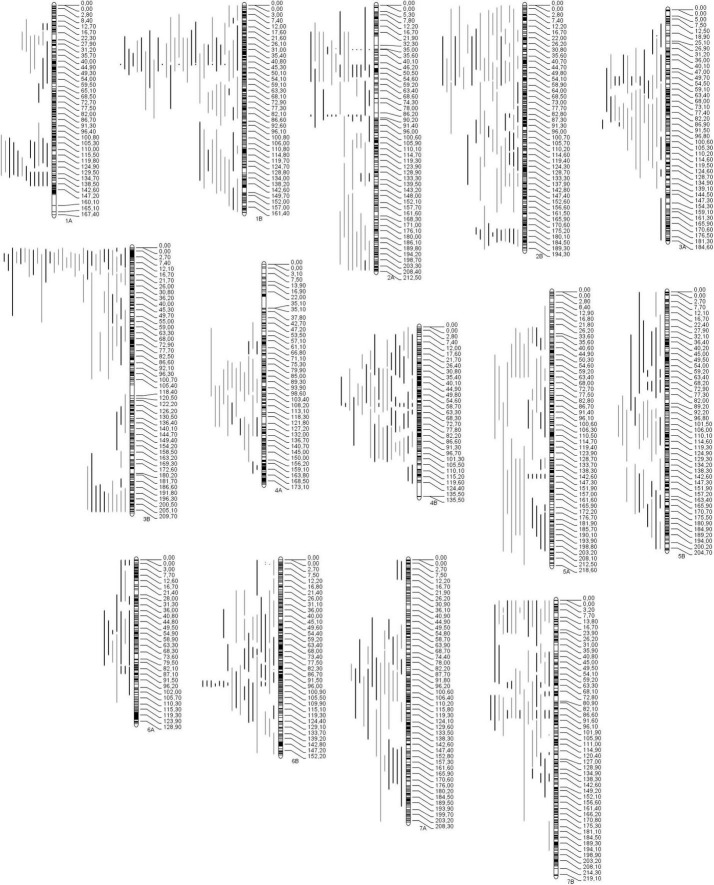
FIGURE 2.
Distribution of the QTL projected throughout all 14 chromosomes (genomes A and B) of durum wheat. QTL were collected for 19 traits related to the main yield components, grains number per area (gray bars) and grain weight (black bars). Black bars within chromosomes represent marker density.

