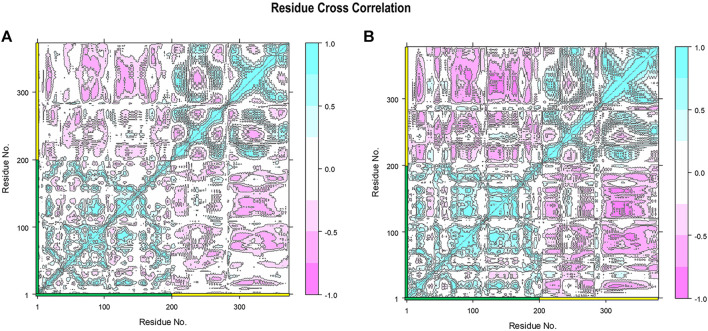
FIGURE 13.
Residue cross-correlation matrix of gRBDfN and gmRBDfN is calculated over 100 ns MD simulations for CA atoms. Shades of red and blue spots present the atom’s correlated and anti-correlated motions, respectively. The gRBDfN and gmRBDfN systems are shown in (A) and (B). The amino acid residues of RBD and ferritin are marked on the x and y axes with green and yellow, respectively. The values of the correlations range from -1 to 1 as shown in the bar on the right.

