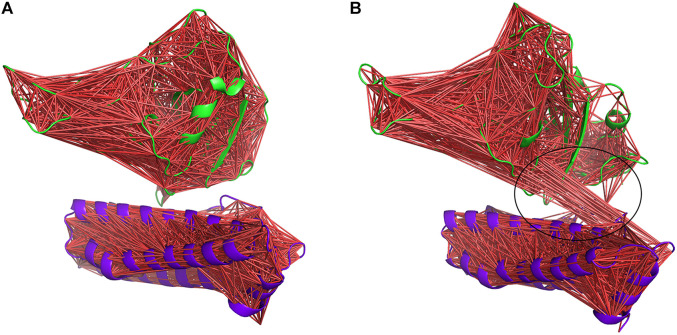
FIGURE 14.
DCCM of gRBDfN and gmRBDfN is calculated over 100 ns MD simulations. gRBDfN and gmRBDfN are shown in (A) and (B), respectively. Dark red lines show anti-correlated motions between RBD in green and ferritin in purple cartoons. Specific anti-correlated motions between the ferritin and RBD are shown in the circle in picture (B).

