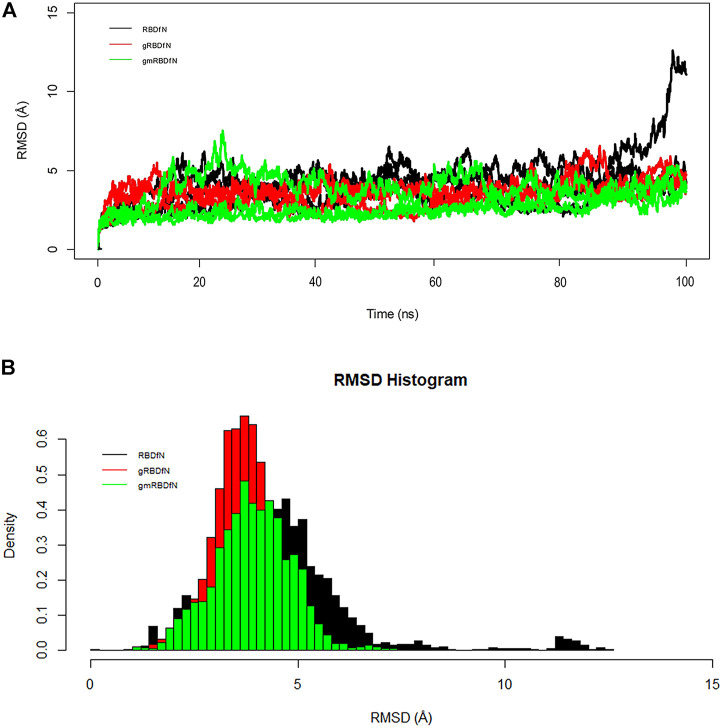
FIGURE 3.
(A) RMSD of all systems is calculated over 100 ns MD simulations. The structural distance of CA atoms calculated for all replicates of RBDfN, gRBDfN, and gmRBDfN systems are shown in black, red, and green, respectively. (B) RMSD distribution of CA atoms is calculated over 100 ns MD simulations for the first replicates. RBDfN, gRBDfN, and gmRBDfN systems are shown in black, red, and green, respectively.

