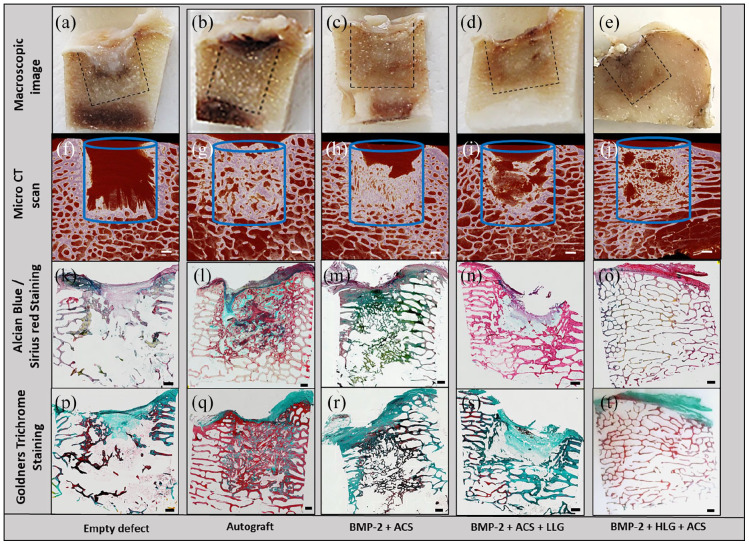
Figure 4.
Micro-CT, macroscopic and microscopic sagittal sections of the femoral condyle defect groups. Macroscopic images of the central regions of the condyle defect from each group (a–e). Micro-CT scan sections of the defect groups (f–j). Alcian blue/Sirius Red (k–o) and Goldners trichrome (p–t) staining of condyle defect sections. Scale bar = 1 mm.

