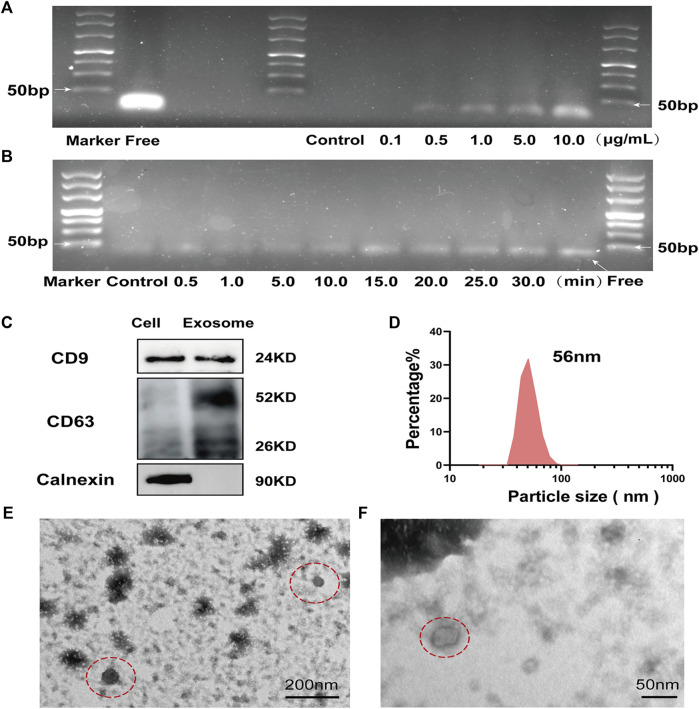
FIGURE 3.
Response of MBs-Apt63 to UV in vitro and identification of exosomes (A) Agarose gel electrophoresis (molecular weight of free aptamer = 32 bp) of MBs-Apt63 at different concentrations after UV exposure; (B) Agarose gel electrophoresis of MBs-Apt63 (10.0 μg/ml) after exposure to UV for different times (molecular weight of free aptamer = 32 bp). (C) The expression of CD9, CD63 and calnexin determined by western blotting; (D) The particle size of breast cancer cell exosomes characterized by DLS; (E,F) Transmission electron microscopy image of breast cancer exosomes (magnification = 50000× in C and 100000× in D, exosomes are shown in the red dotted circle).

