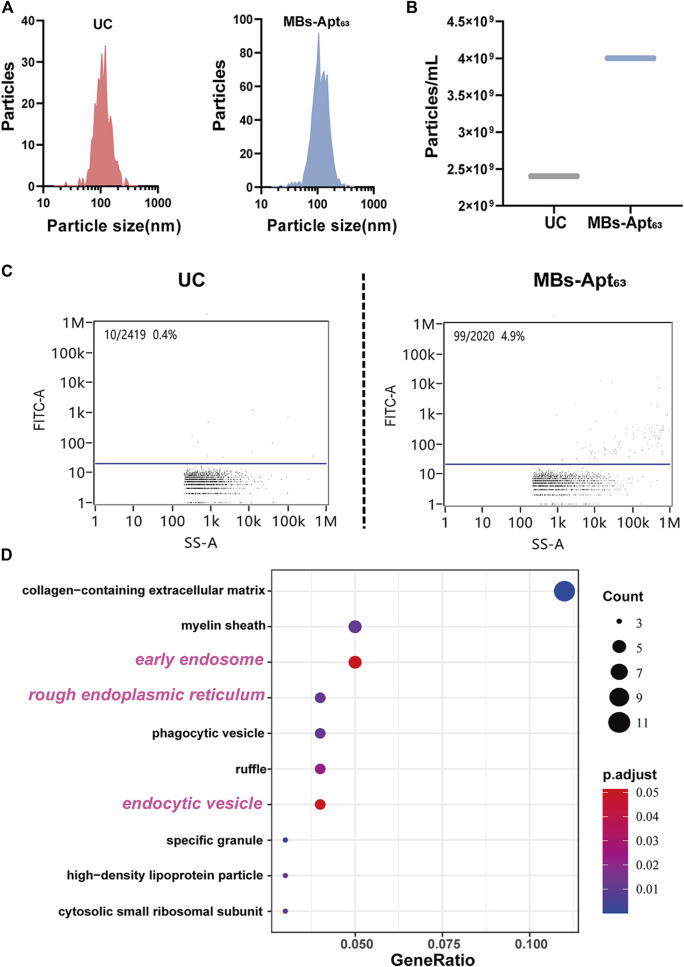
FIGURE 5.
Evaluation of MBs-Apt63 in the isolation of serum tumor exosomes. (A) Particle size distributions of exosomes extracted by UC and MBs-Apt63. (B) Average serum exosome concentrations prepared by UC or MBs-Apt63; (C) Expression abundance of CD63 in exosomes isolated by UC and MBs-Apt63. Results were obtained from nanoflow flow test; (D) GO analysis of proteins from exosomes separated by MBs-Apt63 or UC. Top 10 GO components are displayed that are most enriched in exosomes separated by MBs-Apt63 (p < 0.05 as significance).

