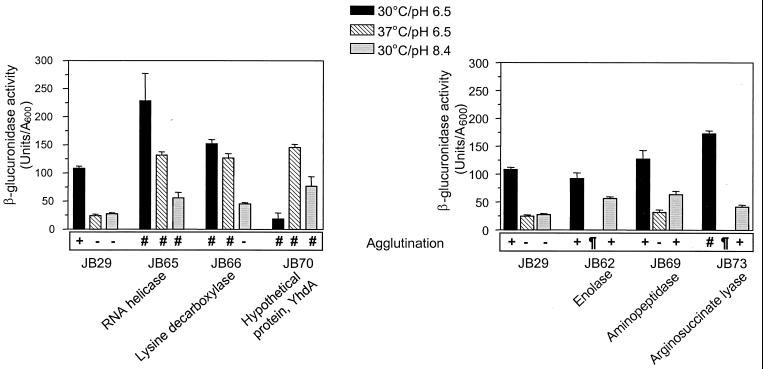
FIG. 1.
β-Glucuronidase activity in three different growth conditions of V. cholerae O395 carrying a toxT-gusA fusion and six transposon-generated mutant strains. The left panel shows the control strain compared with three mutants exhibiting defective regulation of toxT-gusA expression in response to both temperature and pH. The right panel shows the control strain and three mutants exhibiting defective regulation in response to pH. The agglutination phenotypes are shown at the bottom of each graph. The symbols used for agglutination in the figure represent the following: +, agglutination; −, no agglutination; ¶, strain failed to grow; and #, strain grew too poorly to allow analysis of agglutination. Also shown in the figure are the proteins in the database showing the highest degree of homology to the disrupted sequences in each of the mutants. The data represent means plus the standard deviations (SDs) of two independent experiments, each done in duplicate.

