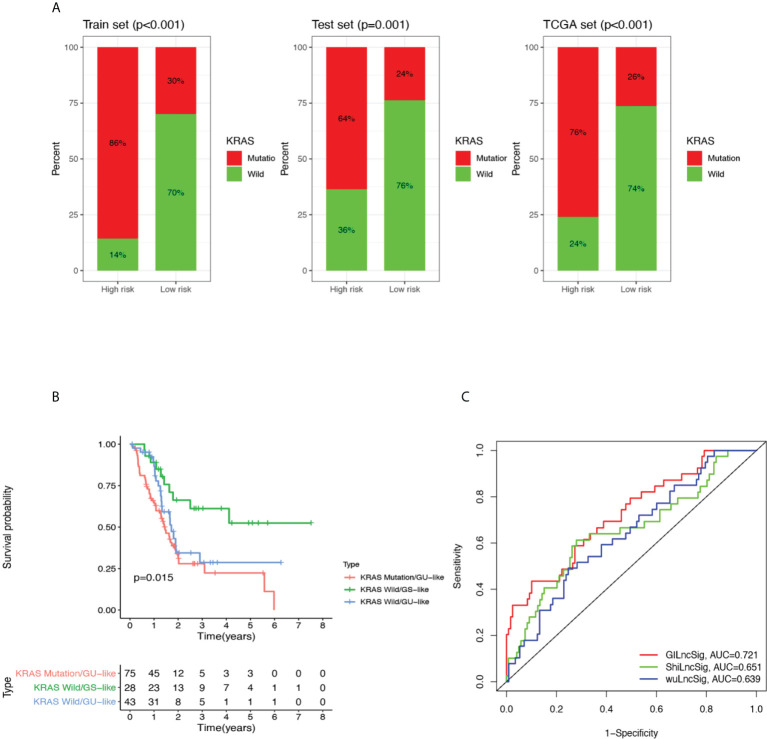
Figure 4.
Performance comparison of GILncSig with KRAS paradigm and lncRNA-related prognostic models derived from other studies. (A) The proportion of KRAS mutations in high- and low-risk groups in the training set, testing set and the TCGA cohort. (B) Kaplan-Meier curve analysis of overall survival for PDAC patients belonging to KRAS Mutation/GU-like group, KRAS Wild/GU-like group and KRAS Wild/GS-like group for patients classified by KRAS mutation status and GILncSig. Statistical analysis was performed using the log-rank test. (C) The ROC analysis at 3 years of overall survival for GILncSig, WuLncSig, and ShiLncSig.

