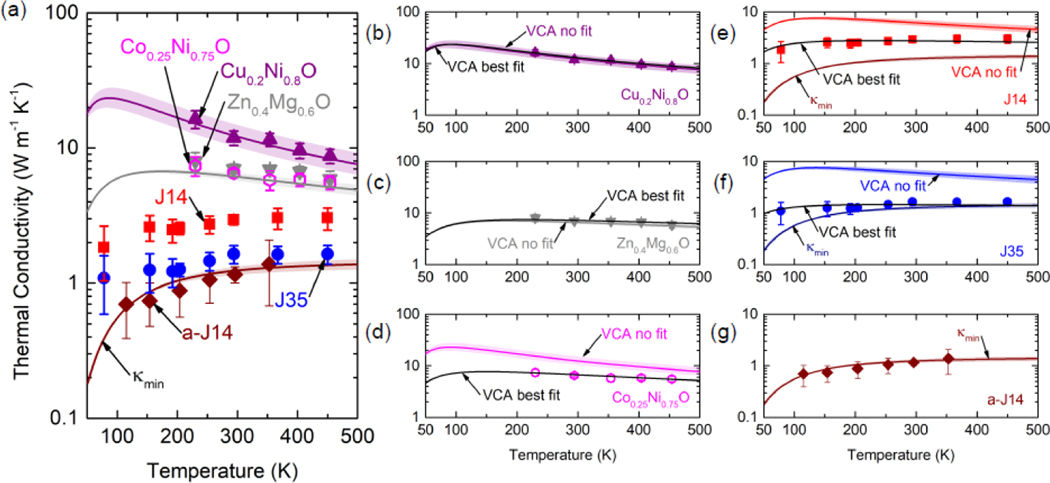
FIG. 3.
(a) Thermal conductivity vs. temperature. Purple and gray lines depict VCA models without fitting parameters for Cu0.2Ni0.80 and Zn0.4Mg0.60, while maroon line is the minimum thermal conductivity model for J14 (); shaded regions indicate uncertainties in the model. Thermal conductivity data is shown together with VCA models with and without adjustable parameters for (b) , (c) , (d) , (e) J14 (f) J35, and (g) a-J14.

