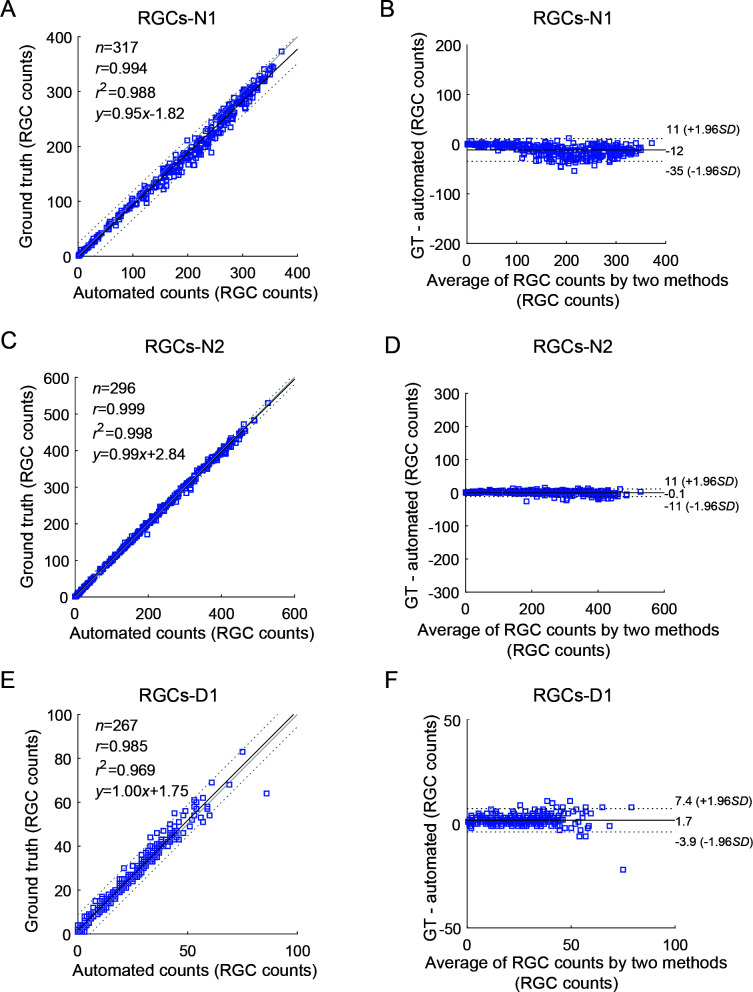
Figure 7.
Linear regression analysis and Bland-Altman plots of ground truth (GT) versus automated counts
First and second lines represent results of the two test images, respectively. A, C, E: Comparison of linear relationship between algorithm and real results. Continuous line is the best-fit line, and adjacent dotted lines represent 95% confidence intervals. B, D, F: Bland-Altman plot. Dotted lines indicate 1.96 SD region or 95% confidence interval. RGCs-N1, RGCs-N2, and RGCs-D1: Retinal ganglion cells in normal mouse 1, normal mouse 2, and degenerative mouse 1, respectively.

