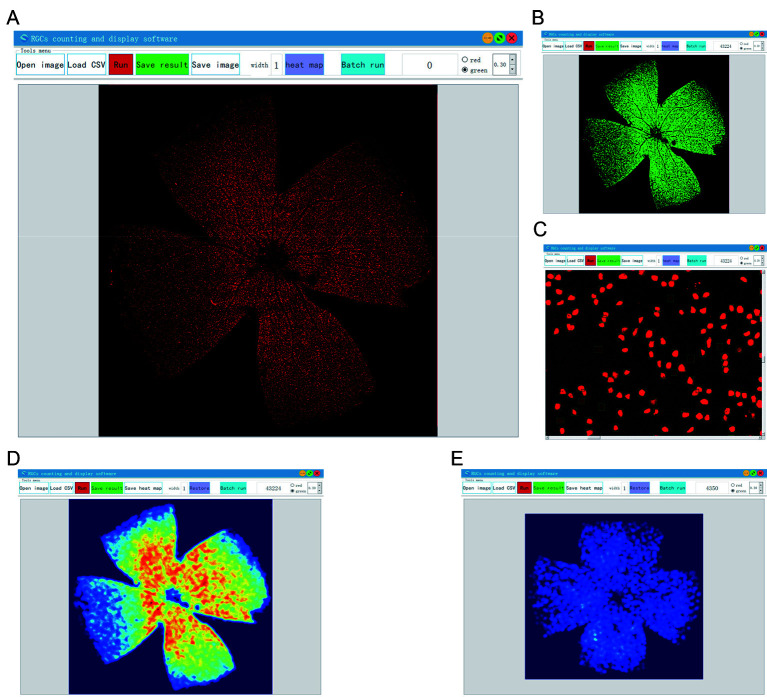
Figure 9.
Automated software for RGC labeling
A: Import the image. Image can be zoomed in and out with the mouse to view details or outlines. B: Algorithm results. Click “Run” button. After a short wait, number of calculated RGCs can be seen in the upper right corner of the screen. Positions of each RGC are displayed in a green or red rectangular box on the image. The cut-off points for each detected RGC can be adjusted in the software to determine results. The cut-off point is 0.6 by default. C: Partial enlargement of entire retinal image. D, E: Heat map, which can visualize density function to represent density of dots in a map, enabling perception of point density independent of the zoom factor.

