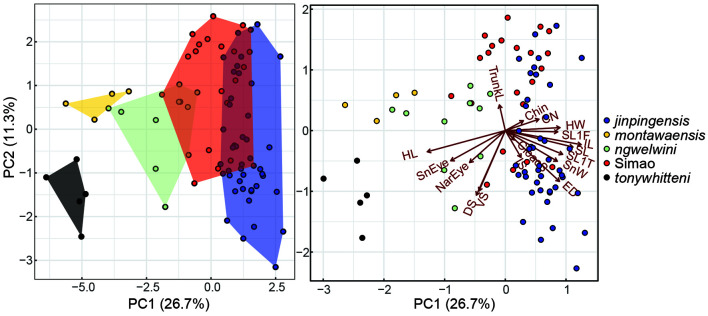
Figure 3.
Principal component analysis (left) and biplot (right) of compared species within clade 4
Graphs show morphospatial relationships along first two components. Dots indicate positions of individuals in PCA morphospace and arrows indicate vectors for each morphological trait (acronyms for traits are indicated).

