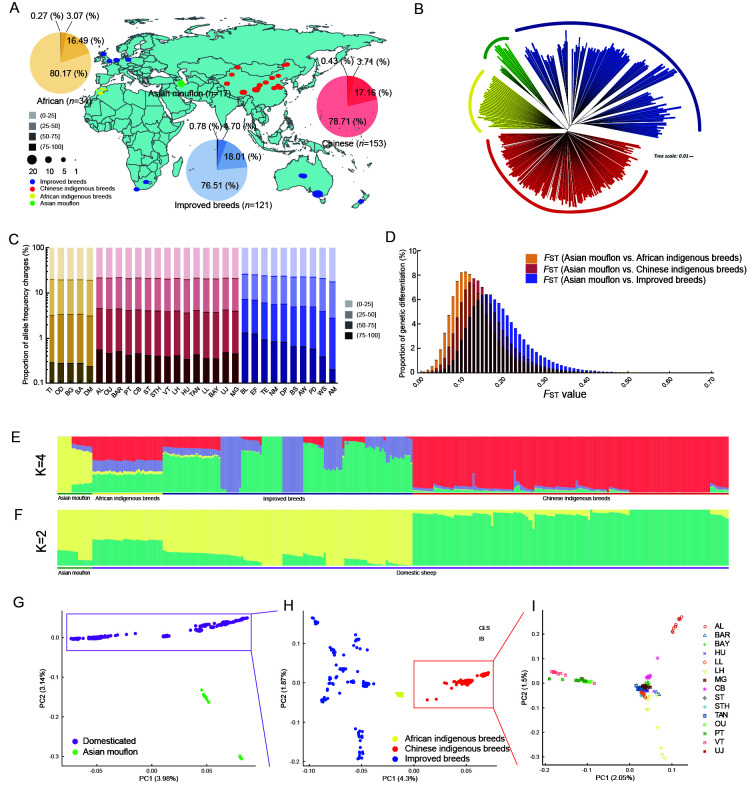
Figure 1.
Genomic diversity and population genetics of wild and domestic sheep
A: Geographic distribution of 31 breeds sampled. Each breed is indicated as a dot on the map. Population-based proportions of allele frequency changes are displayed using a pie chart. B: Neighbor-joining phylogenetic tree of 325 sheep. C: Proportion of allele frequency changes for each breed. D: Distribution of genetic differentiation (FST) across three groups. E, F: Population structure of 325 individuals using ADMIXTURE with k=2, 4. G–I: Principal component analysis (PCA) of 325 individuals, domesticated group, and Chinese indigenous breeds, respectively. Different subgroups or breeds are indicated by different colors and shapes in each figure; domesticated group includes African indigenous breeds, Chinese indigenous breeds, and improved breeds.

