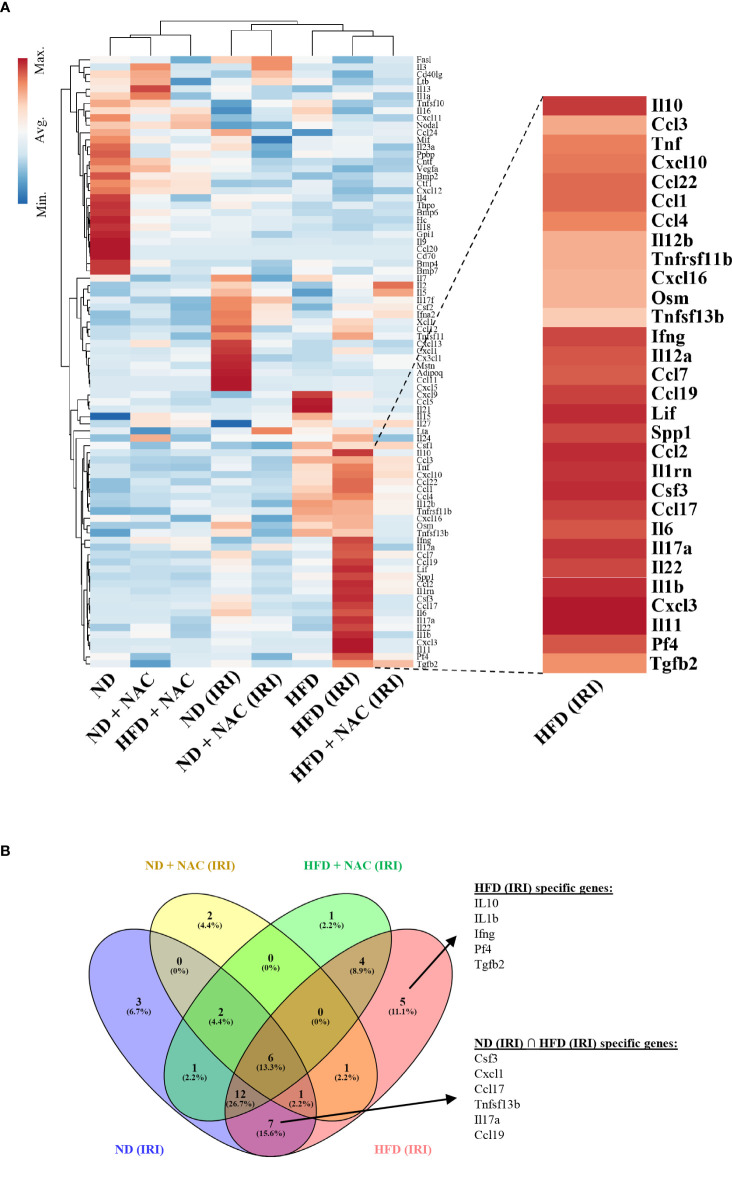
Figure 6.
IRI induced specific genetic upregulation in HFD mice. RT2 profiler PCR array for cytokines and chemokines was utilized to examine differences in genetic regulation among treatment groups. Each group represents a single pooled sample from at least three separate liver-tissue specimens. (A) Heat map of cytokine and chemokine PCR analysis. (B) Venn Diagram demonstrating genes that are upregulated in HFD (IRI) and those shared amongst ND (IRI) and HFD (IRI).

