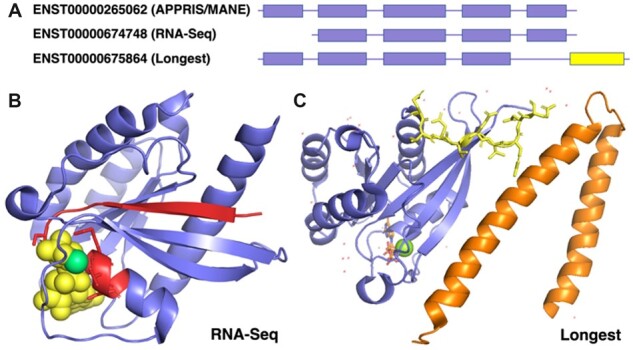
Fig. 3.

RNA-Seq dominant transcripts and longest isoforms for RAB7A. (A) The reference transcripts selected by different methods for RAB7A. APPRIS and MANE chose the same transcript. The RNA-Seq transcript (ENST00000674748) is missing the first coding exon; the longest isoform has a different 3′ CDS (in yellow). (B) The predicted effect of the transcript chosen by RNA-Seq data, mapped to the resolved structure of Rab-7a (PDB: 1T91). The region in red would be missing from this isoform of Rab-7a. The GTP molecule is shown in spacefill in yellow and the magnesium ion in green. The lost GTP binding motif is shown as red sticks. (C) The predicted changes brought about by the longest isoform, mapped to the resolved structure of Rab-7a (PDB: 1YHN). Rab-7a is shown in blue and the RILP structure in orange. Residues that would be swapped for unrelated residues are shown as yellow sticks. Tyrosine 183, the residue closest to RILP, nestles in a hydrophobic pocket in RILP (Wu et al., 2005). It would be lost in the longest isoform
