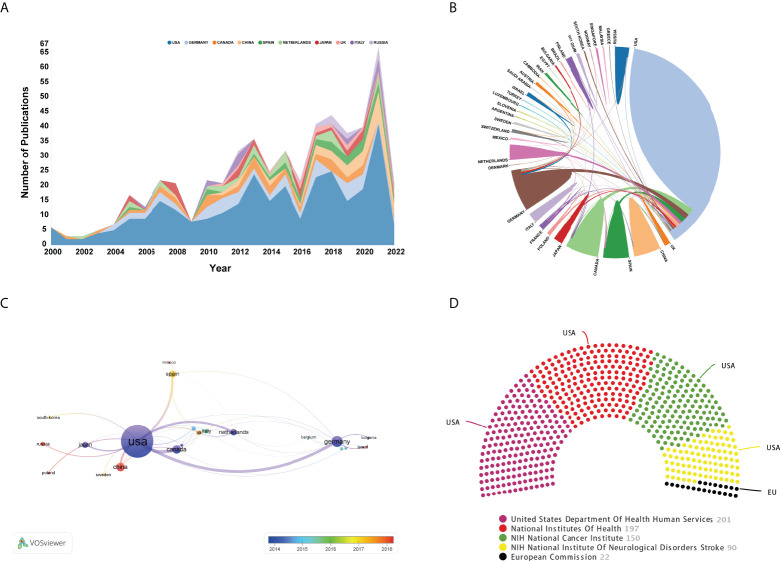
Figure 5.
(A) Annual number of publications of the top 10 most prolific countries. (B) Cooperation of countries/regions. The links between countries/regions represented cooperative relationships and a thicker line indicated a stronger cooperation. (C) Overlay visualization map of countries/regions co-authorship analysis conducted by VOSviewer. The nodes represented countries/regions and the links between nodes indicated link strength of a co-authorship relation. The larger the node, the more documents were published by the country. Node color reflected the corresponding average appearing year (AAY) of each country. Based on the color gradient in the lower right corner, red represented the relatively recently published countries, while blue represented the earlier published countries. (D) The top 5 funding bodies sponsored the highest number of studies in this domain.

