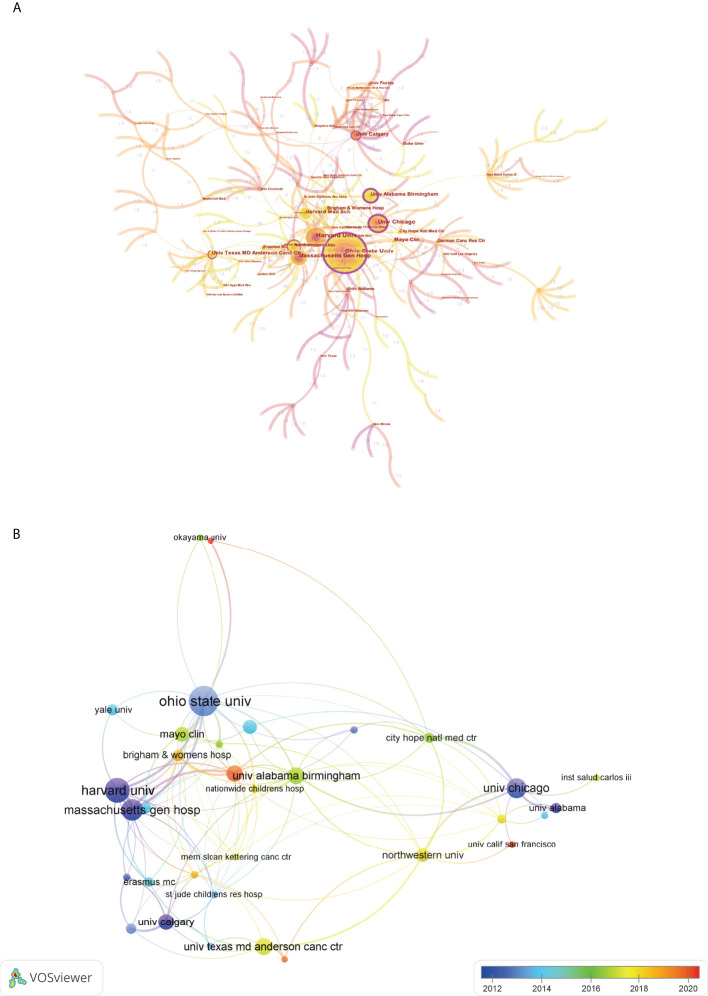
Figure 6.
(A) Cooperation network map of institutions by using CiteSpace. The nodes represented institutions and the lines mean cooperative relationships between them. The node size was proportional to the publication number. The nodes with outermost purple circle indicated a higher centrality. (B) Overlay visualization map of institution co-authorship analysis by using VOSviewer. The meaning of colored lines and nodes was similar to Figure 5C .

