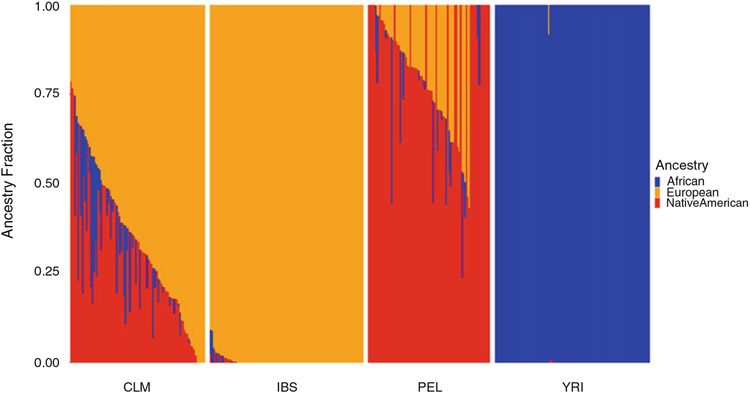
Fig. 2.
ADMIXTURE plot of four human populations: Colombia (CLM), Spain (IBS), Peru (PEL), and Yoruba (YRI). Each column is an individual, and for each individual the ancestry fraction for each of three continental population groups is shown: African (blue), European (orange), and Native American (red)

