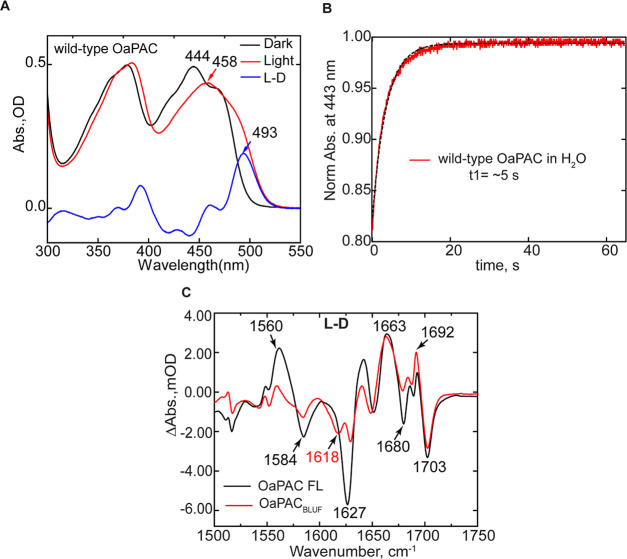
Figure 2.
UV–visible absorption and FTIR difference spectra of wild-type OaPAC. (A) Steady-state absorption spectra for wild-type OaPAC in the dark and light. (B) Dark-state recovery of the band at 444 nm which has a time constant of ∼5 s. C. Comparison of the steady-state IR difference spectrum of full-length OaPAC (OaPAC FL) with OaPACBLUF. The FTIR difference spectrum was obtained using 1 mM protein in a 50 μm CaF2 cell. The L – D spectrum was generated by subtracting the IR spectrum of OaPAC acquired before irradiation from the spectrum acquired, while the sample was irradiated using a 455 nm mounted LED for at least 20 s.

