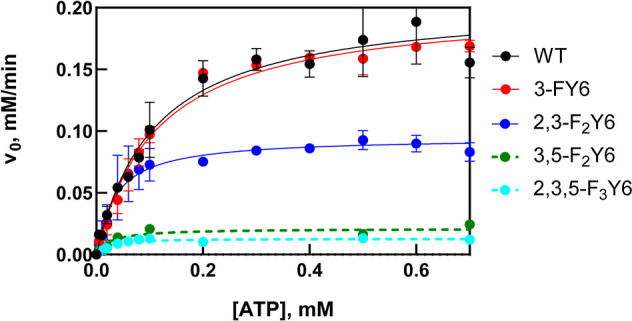
Figure 9.

Michaelis–Menten plots of wild-type (WT) OaPAC and n-FY6 variants. Each point represents the initial velocity at each ATP concentration extracted from the linear portion of the A340 vs time plot under continuous illumination. The lines are the result of nonlinear fits to the Michaelis–Menten equation. Each data point is the average of two replicates where the error bars represent the standard error of the mean.
