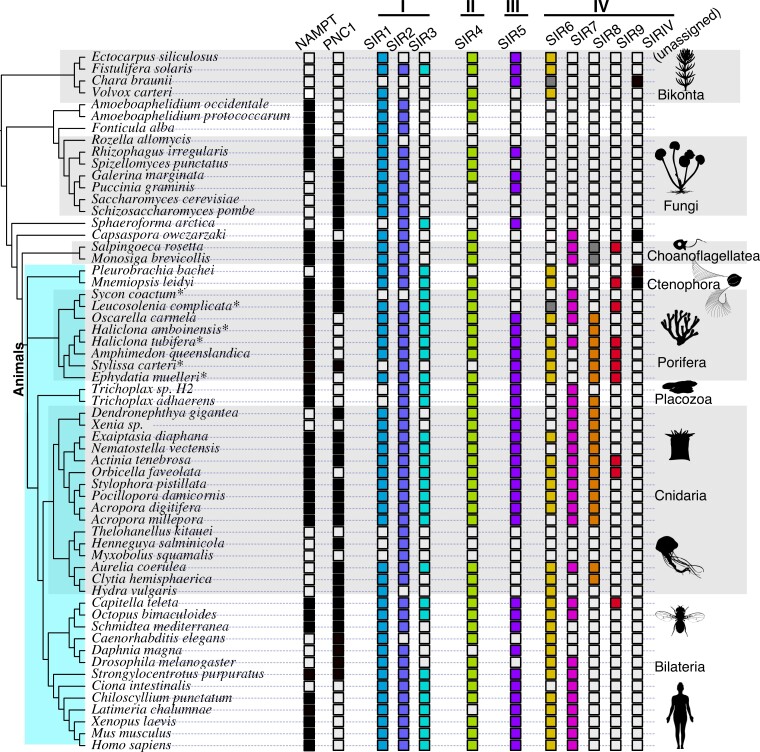
Fig. 3.
Distribution of NAMPT, PNC1, and sirtuins across our data set. Asterisks next to species names imply the data come from a transcriptome as opposed to a genome, meaning absence of genes should be taken with caution. Gray squares indicate that one or more sirtuins from this taxon might be members of the relevant clade, but the assignment lacked statistical support (rapid bootstrap values ≥90).

