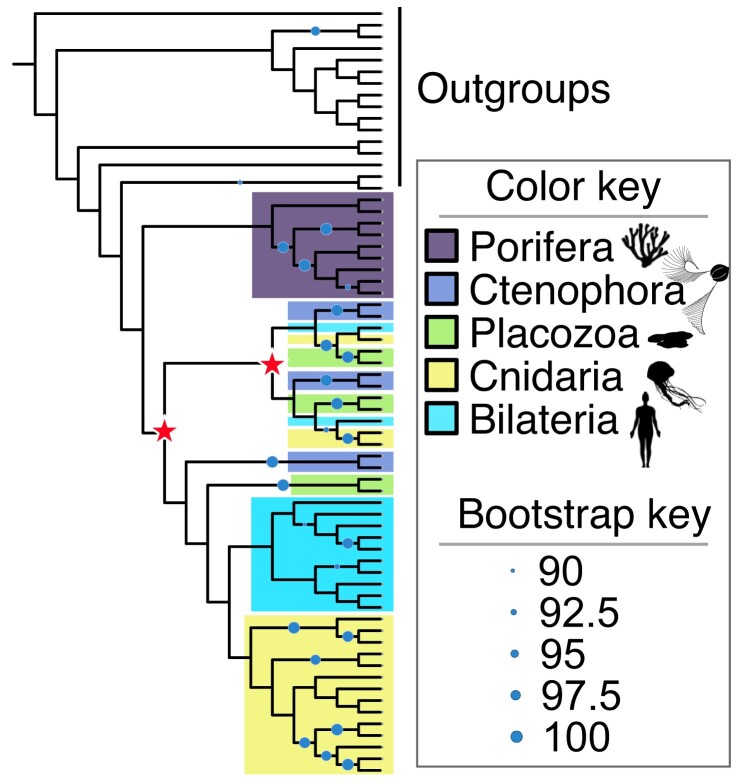
Fig. 5.
Phylogeny of SIR2 proteins. These results are from an independent analysis of SIR2 proteins separate from the rest of the data set (see Materials and Methods for details). Circles indicate nodes with Ultrafast Bootstrap Approximation values ≥90. Stars indicate putative gene duplication events. Note that this tree assumes that Porifera represents the earliest-branching clade of animals. A ctenophore-first phylogeny results in a different, more complex pattern of gene duplication events. See the GitHub repository for detailed results.

