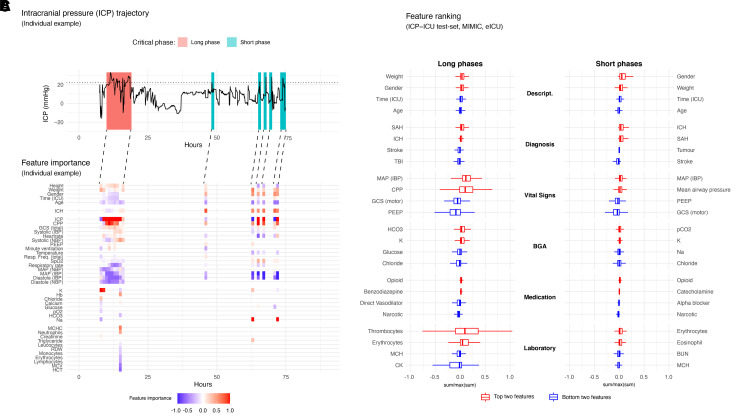
Figure 4.
Feature importance of the prediction of long and short critical phases of intracranial pressure. (A) A representative ICU trajectory of an individual patient with invasive ICP monitoring is presented, having a long critical phase in the beginning and several shorter critical phases at the end. The individual ICP course is depicted over time (h); the horizontal dashed line represents our threshold for the definition of critical phases (ICP 22 mmHg). (B) Gradient based saliencies were calculated from five independent models based on the prediction 2 h in advance of the critical phases. All other features which had a low influence are not shown for that trajectory. The lines connecting the saliency and ICP plot demonstrate the predictive horizon. The prediction takes place 2 h in advance and the important features for that prediction at that time are demonstrated. The colour scale is continuous between −1 (blue) and 1 (red). Values being positive are red (to be considered as bad) because their higher values are positively correlated with the prediction of critical phases. Negative values (blue) represent negatively correlated values with the positive prediction. (C) To have a broader view on the top features over all validation datasets (ICP-ICU test set, MIMIC and eICU), the sum of all saliencies per timestep were calculated. The top (red) and bottom (blue) two features are shown for each group. Descript. = patient characteristic, diagnosis, vital signs, BGA, medication, laboratory value; and for each target long (left) and short (right) critical phase. The lower and upper hinges of box plots correspond to the first and third quartiles (the 25th and 75th percentiles) the middle line of the median. The upper and the lower whisker extends from the hinge to the largest and smallest value no further than 1.5 × IQR from the hinge.

