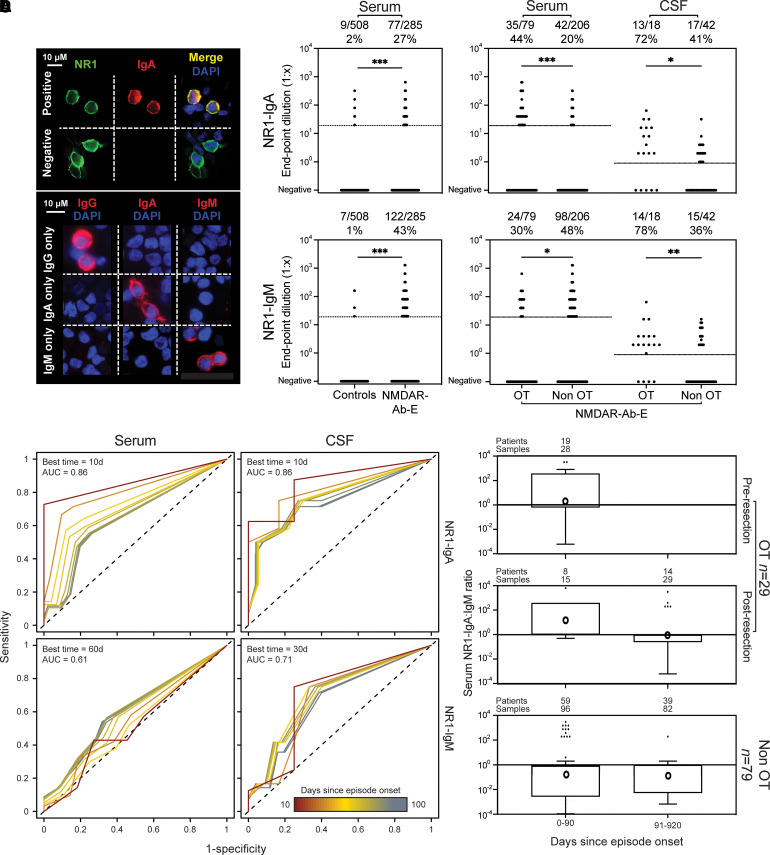
Figure 1.
NR1-directed IgM and IgA antibodies in serum and CSF: association with OT and time from illness onset. (A) Detection of NR1-IgA using a live cell-based assay. Top: HEK293T cells were transiently transfected with the NR1 subunit. Expression demonstrated here with an NR1-directed commercial antibody (green). An anti-human IgA Fc specific antibody visualized binding of serum NR1-IgA (Positive); example of a serum sample without NR1-IgA shown (Negative). Bottom: After isotype-specific antibody depletion with beads (remaining isotype stated on left, white), the detection antibodies used are isotype-specific (detected isotype stated on top, red). DAPI to identify HEK293T cell nuclei. (B) Frequency and end point dilution of NR1-IgA (top row) and NR1-IgM (bottom row) in serum and CSF samples from disease/healthy controls (collectively, ‘Controls’) and from patients with NMDAR-antibody encephalitis (NMDAR-Ab-E). Comparisons of serum and CSF from NMDAR-Ab-E patients divided by OT status (OT versus non-OT). Dotted lines indicate positivity cut-off (serum 1:20, CSF undiluted). (C) Time-thresholded receiver operating characteristic (ROC) curves for serum or CSF NR1-IgA or NR1-IgM and OT association. The area under the curve (AUC) for serological measures was estimated by ROC analysis. AUC values were calculated for sliding 10-day thresholds between 0 and 370 days since the last episode. The optimum cut-off was assessed by Youden’s J statistic. Ten-day time thresholds from onset to 100 days are shown and indicated by the colour scale (red = earliest, blue = latest). In the top left of each box, the time window optimally associated with OT is indicated. Models were unaltered with removal of males. (D) Pseudo-log transformed (negative results replaced with 0.1) ratios of serum NR1-IgA:NR1-IgM end point dilutions are plotted over time in patients with and without an associated OT. Samples from OT patients are further subdivided by sampling before or after OT resection. Ratios are plotted on a logarithmic scale in time windows and summarized by box plots using the Tukey method where the horizontal line is the median and individual dots are outliers. Geometric means are indicated by circles. All OT-associated cases underwent OT resection. Upper time limit has been restricted to 920 days post-onset. d = days; DAPI = 4′,6-diamidino-2-phenylindole; NMDAR-Ab-E = NMDAR-antibody encephalitis; OR = odds ratio.

