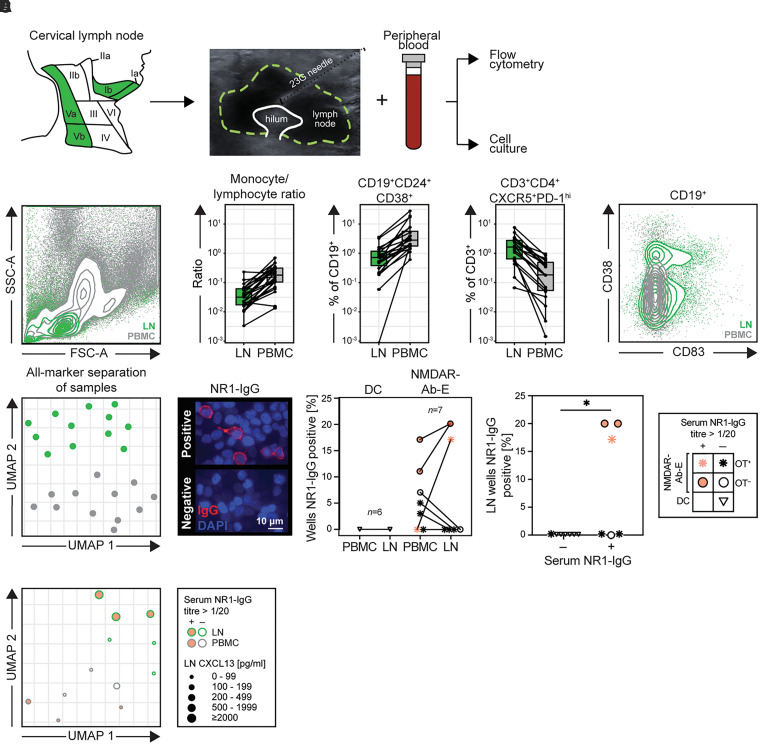
Figure 4.
Evaluation and characteristics of cervical lymph node aspirates. (A) Patient cervical lymph nodes (level Ia, Ib, Va or Vb) were accessed using ultrasound-guided fine needle aspiration. Alongside paired PBMCs, the material was processed for flow cytometry and cell culture experiments. (B) Lymphocytes, monocytes and nine B and three T cell populations were manually gated. Statistical comparisons were made for lymph node (LN)-PBMC sample pairs (LN = green, PBMC = grey). Left: a representative scatter plot showing superimposed LN and PBMC populations, demonstrating a characteristic absence of granulocyte populations in the LN plot. Middle: The three most significantly different parameters (Benjamini–Hochberg corrected Wilcoxon signed-rank tests P-values all <0.0001) between LN and PBMC are shown (monocyte:lymphocyte ratio, CD19+CD24+CD38+ transitional B cells and CD3+CD4+CXCR5+PD-Ihi T follicular helper cells). Right: Flow cytometry plot representative of LN versus PBMC comparisons showing GC B cells (CD19+CD83+, both with and without CD38) exclusively in CLNs. (C) UMAP of all 13 cell subset percentages. Each point represents one sample. (D) Left: Examples of NR1-IgG positive and negative culture supernatants, using live cell-based assay immunofluorescence. Middle: Frequency of cell culture wells with supernatant NR1-IgG reactivities, from paired peripheral blood and lymph node material, in seven samples from patients with NMDAR-antibody encephalitis and six disease controls. LN cultures produced NR1-IgG from samples from Patient 1 (Visits 1 and 2) and Patient 2. Right: Frequency of NR1-IgG positivity from LN cultures divided by a routine cut-off (1:20) for serum NR1-IgG end point dilution positivity. Key: Samples with serum NR1-IgG reactivities are coloured pink and patients with OT are indicated by an asterisk; disease control patients are indicated by inverted triangles. (E) UMAP of all 13 cell subset percentages from cultured PBMC (grey outline) and LN (green outline) samples. Points are scaled by concentration of CXCL13 detected in paired serum (PBMC samples) or LN aspirate wash (LN samples). CXCL13 = C-X-C motif ligand 13; CXCR5 = C-X-C chemokine receptor type 5; DC = disease control; FSC-A = forward scatter area; G = gauge, NMDAR-Ab-E = NMDAR-antibody encephalitis;
PD-1 = programmed death 1; SSC-A = side scatter area.

