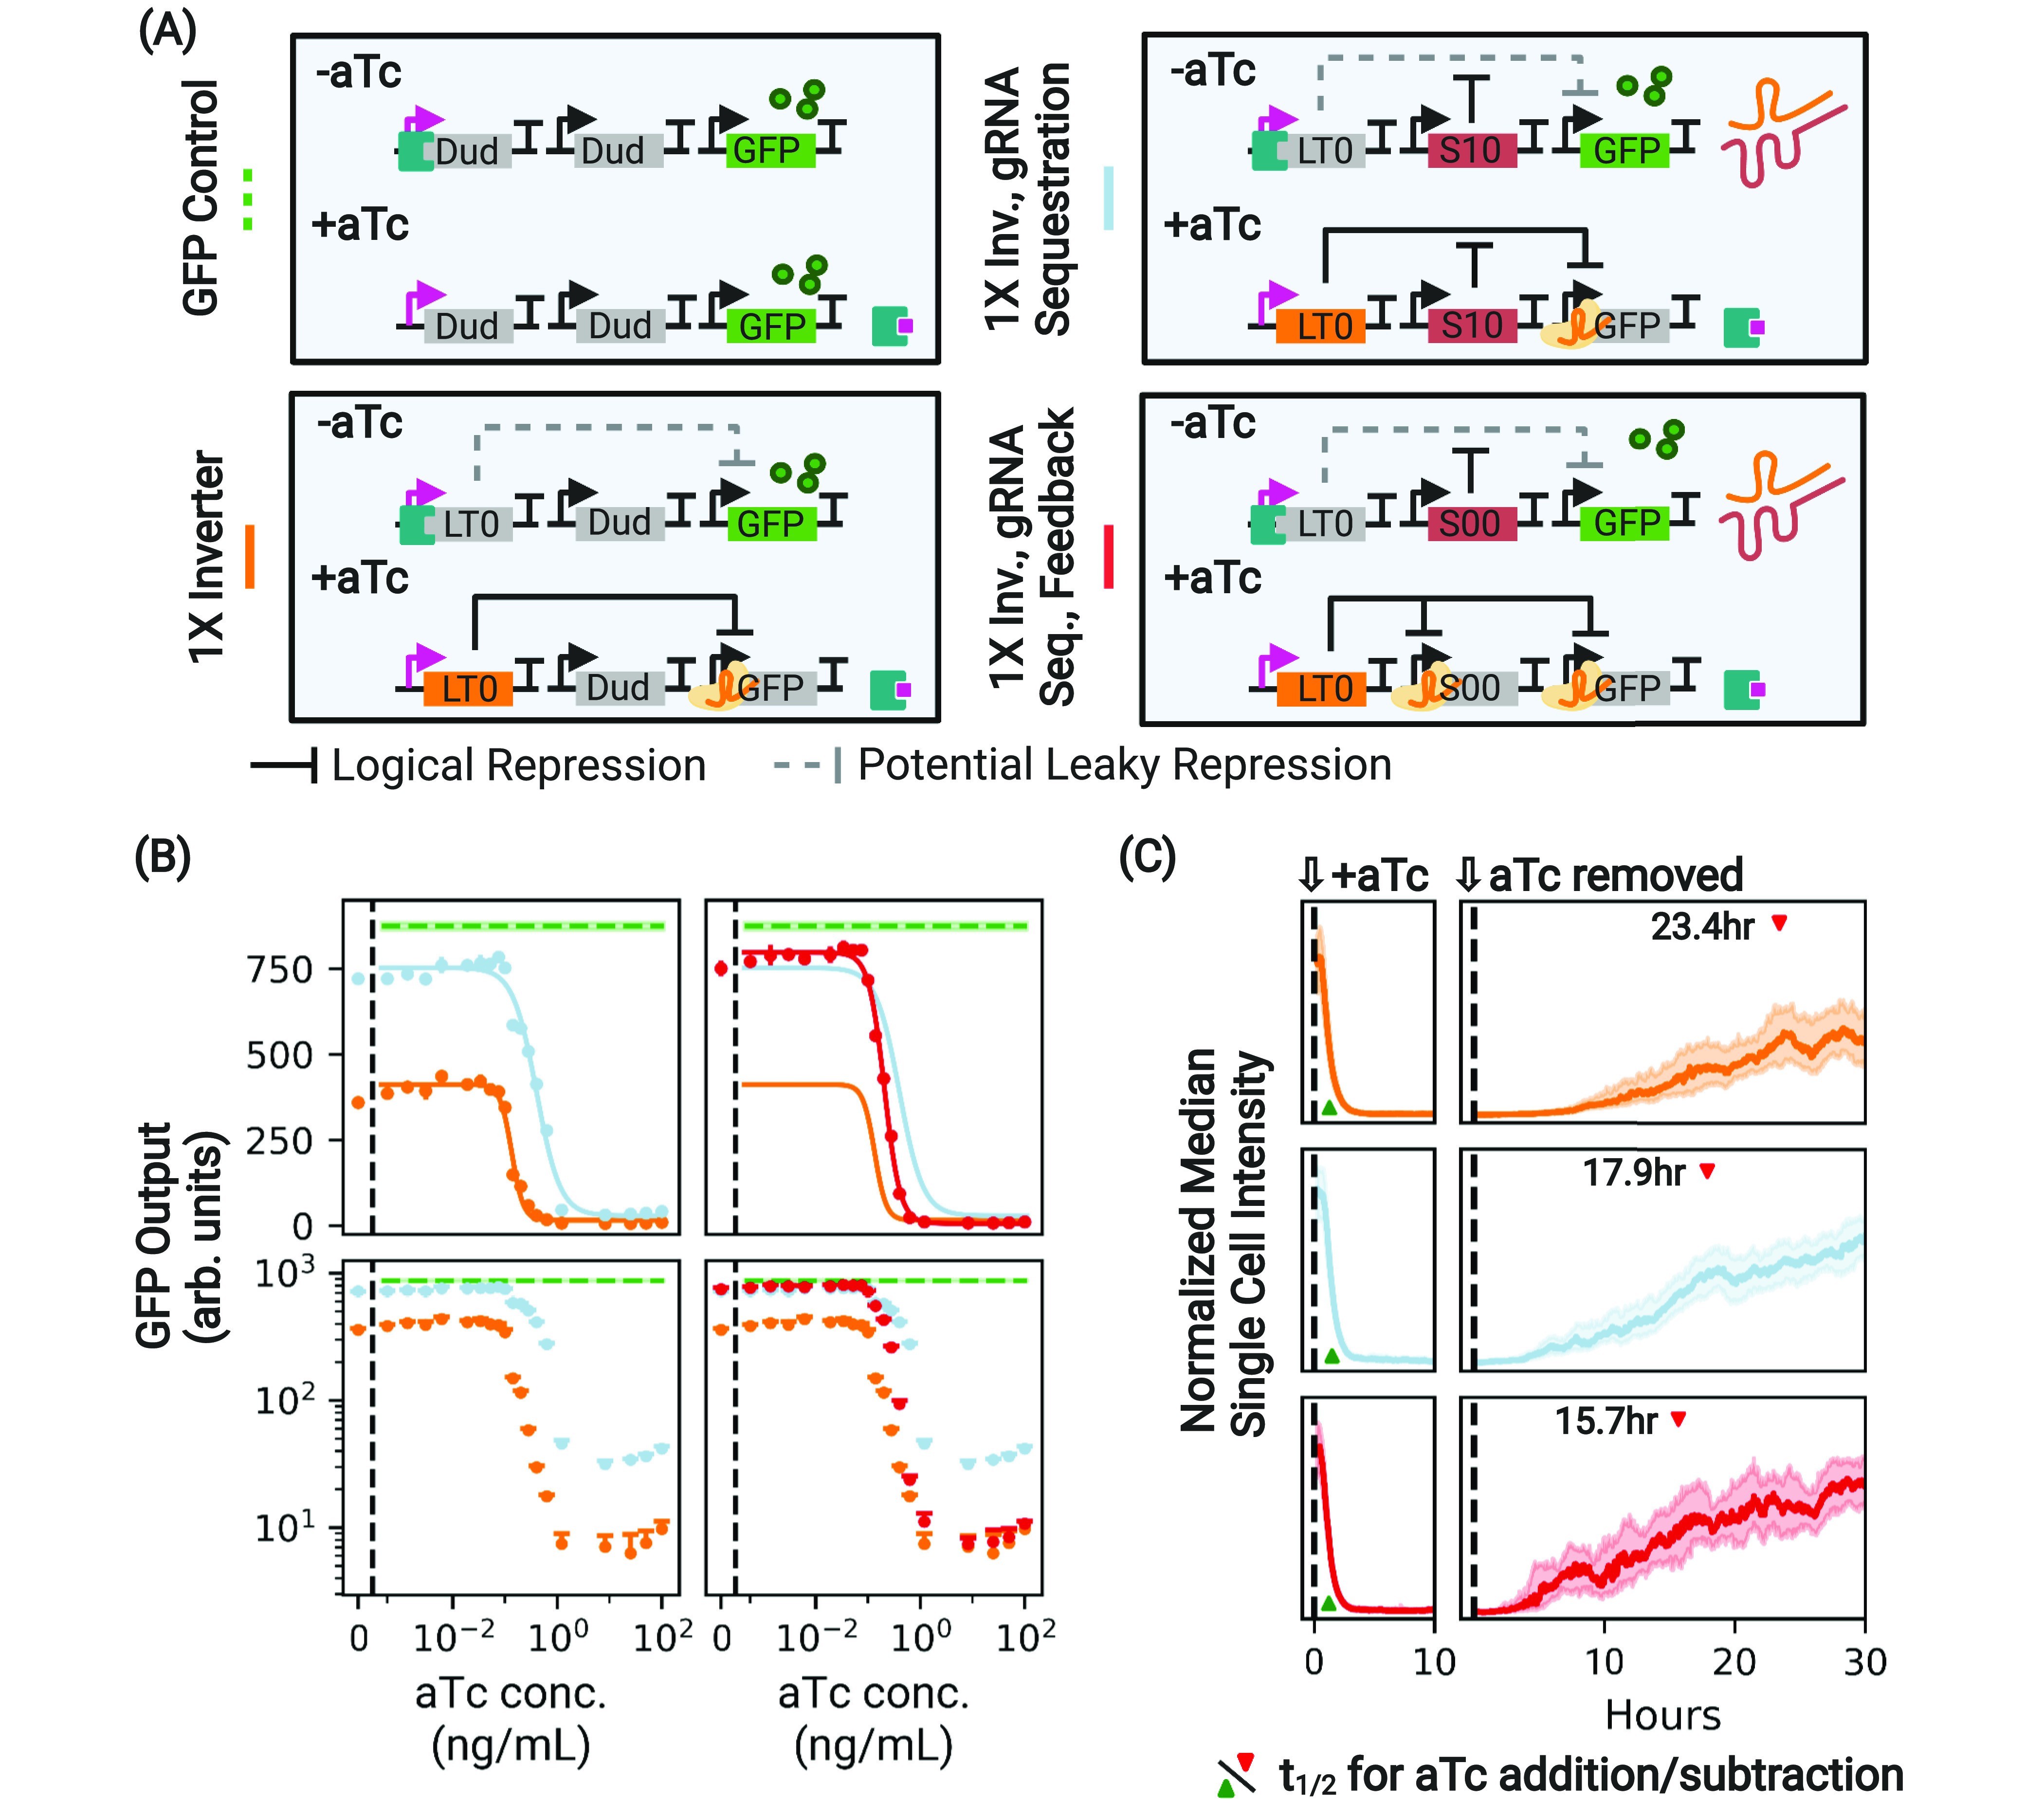
Figure 3.

Antisense sequestration of gRNA increases the dynamic range of a 1× inverter. (A) A control and variants of the 1× inverter with gRNA sequestration designed to have the same compositional context. The additional “Dud” node upstream of the first node in each depicted circuit that constitutively expresses nontargeted asRNA has been omitted for simplicity. (B) During stationary expression, the absolute dynamic range of the basic 1× inverter (orange) is greatly limited by circuit leak, which reduces GFP output with respect to the expected maximum (dotted green) when the aTc concentration is low. Antisense sequestration of the gRNA via S10 (light blue) acts to suppress CRISPRi-based repression, expanding the dynamic range of the circuit. However, this comes at the cost of suboptimally higher expression at high induction, as is evident in log space. The addition of the feedback mechanism (red) suppresses production of the asRNA when gRNA production is high, maintaining a high dynamic range while nullifying the unwanted impacts of sequestration at high aTc concentrations. In linear space, the displayed error bars are ±1 standard deviation from threefold biological replicates. Performance is shown relative to the performance of a GFP control with the same compositional context arrangement of nodes (dashed green line) and the basic 1× inverter (orange). For these and all subsequent experiments, dCas12a and tetR are expressed constitutively in the genome. (C) The same constructs, this time under the addition and subtraction of aTc in a microfluidic chamber. The presence of antisense sequestration (light blue) speeds circuit response under aTc removal (derepression by the dCas protein; t1/2 indicated with a red caret) at the cost of some speed in repression (Table 1). Use of the dCas regulatory feedback restores the speed of repression while maintaining improved speed of derepression. Traces show median intensities of single cells across all microfluidic channels. Shaded regions indicate ±1 quartile. t1/2 was calculated using a spline fit to the microfluidic data (Figures S8 and S9).
