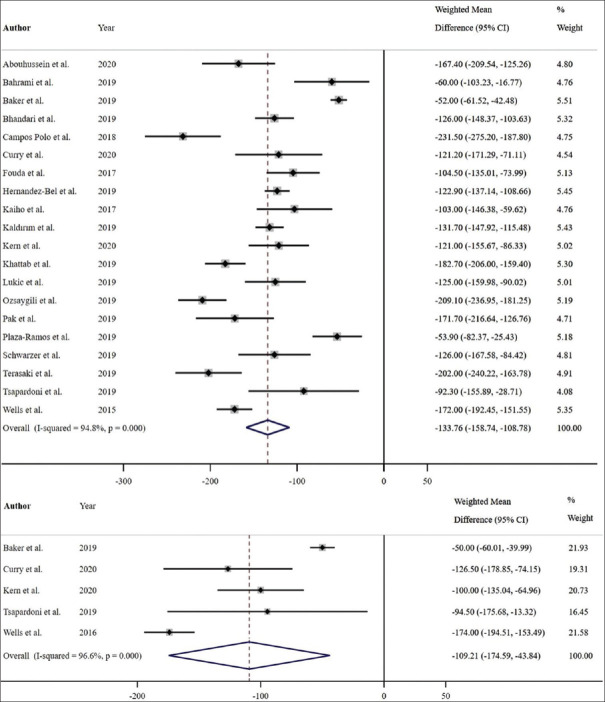
Figure 10.
Estimated weighted mean difference of baseline to 12-month (pictured top), and baseline to 24-month central macular thickness (μm) (pictured bottom). Dashed line represents weighted mean difference. 12-month weighted mean difference: –133.76 μm, P < 0.001. 24-month weighted mean difference: –109.21 μm, P = 0.001. Values reported as crude mean difference, without adjustment for covariates. CI: Confidence interval

