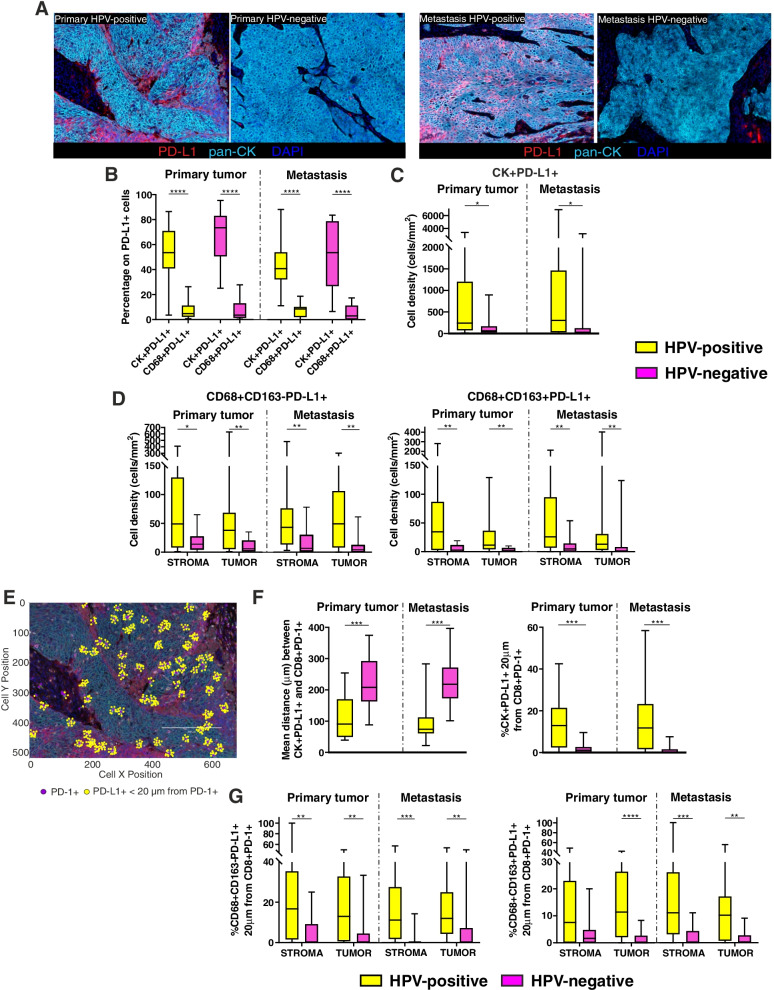
Fig. 6.
Assessment of PD-L1 expression in HPV-positive and HPV-negative primary tumors and related metastases. A Representative multispectral images of HPV-positive and HPV-negative primary tumors (left) and metastases (right). Only PD-L1 (red), pan-cytokeratin (cyan) and DAPI (blue) markers are represented to better appreciate the different PD-L1 expression. Original magnification X20. B Assessment of the phenotype of PD-L1+ cells in HPV-positive and HPV-negative primary tumors and metastases. Data are presented as the percentage of PD-L1+ tumor cells (CK+) or macrophages (CD68+) among the total number of PD-L1+ cells. C Density of PD-L1+ tumor cells in HPV-positive and HPV-negative primary tumors and metastases. D Density of PD-L1+ M1-polarized (CD68 + CD163-) and M2-polarized (CD68 + CD163+) macrophages in the stromal and intra-tumoral areas of HPV-positive and HPV-negative primary tumors and metastases. E Representative images of PD-L1+ cells (yellow dots) within a 20 μm radius from PD-1+ cells (purple dots). F Mean distance between each PD-L1+ tumor cells and the nearest CD8 + PD-1+ T lymphocytes in HPV-positive and HPV-negative primary tumors and metastases (left); percentage of PD-L1+ tumor cells within a radius of 20 μm from CD8 + PD-1+ T lymphocytes in HPV-positive and HPV-negative primary tumors and metastases (right). G Percentage of CD68 + CD163-PD-L1+ macrophages (left) and CD68 + CD163 + PD-L1+ TAM (right) within a radius of 20 μm from CD8 + PD-1+ T lymphocytes in the stromal and intra-tumoral areas of HPV-positive and HPV-negative primary tumors and metastases. Significantly different data are represented by *p < 0.05, **p < 0.01, ***p < 0.001 and ****p < 0.0001

